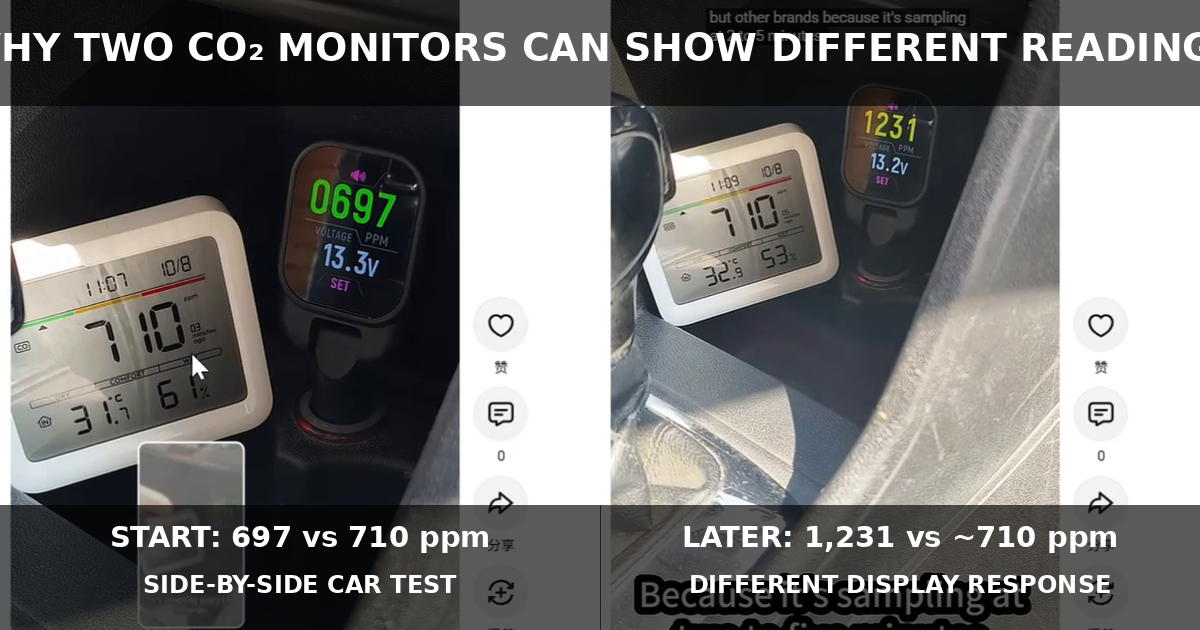
If two CO₂ monitors are sitting next to each other, should they always show the same number at the same time?
We tested that question inside a car.
We placed our EVO-CO2V next to another CO₂ monitor and watched both displays while cabin CO₂ changed.
At the beginning of the recorded sequence, the two readings were relatively close:
EVO-CO2V: 697 ppm
Comparison monitor: 710 ppm
As the test continued, the EVO-CO2V display changed through approximately:
721 → 746 → 1,178 → 1,231 ppm
During the same visible sequence, the comparison monitor continued displaying approximately:
710 ppm
This does not automatically tell us which monitor was more accurate at every instant.
But it clearly demonstrates something important:
Two CO₂ monitors can respond very differently when the concentration around them is changing.
Quick Answer
These are the directly visible readings from our video:
| Stage | EVO-CO2V | Comparison monitor |
|---|---|---|
| Beginning | 697 ppm | 710 ppm |
| Later | 721 ppm | ~710 ppm |
| Later | 746 ppm | ~710 ppm |
| Later | 1,178 ppm | ~710 ppm |
| Later | 1,231 ppm | ~710 ppm |
The key observation was not simply that the numbers were different.
At the beginning, they were only about:
13 ppm apart
But as cabin CO₂ changed, one display continued changing while the other remained around 710 ppm during the sequence shown.
Watch Our Real Side-by-Side CO₂ Monitor Test
Video published on YouTube: October 9, 2025
In our side-by-side car test, the EVO-CO2V started at about 697 ppm while the comparison monitor showed about 710 ppm. As cabin CO₂ changed, the EVO-CO2V display later reached about 1,231 ppm while the comparison display remained near 710 ppm during the recorded sequence.
Why We Ran This Test
CO₂ monitors are often compared by putting two instruments next to each other.
If their screens show different values, it is tempting to immediately conclude:
One of them must be wrong.
But that conclusion can be too simple.
Two instruments can have different:
- measurement intervals;
- sensor response times;
- averaging algorithms;
- display-update intervals;
- calibration characteristics.
So we wanted to observe what happened when both monitors experienced the same changing cabin environment.
What We Saw at the Beginning
At the beginning of the video, the EVO-CO2V showed approximately:
697 ppm
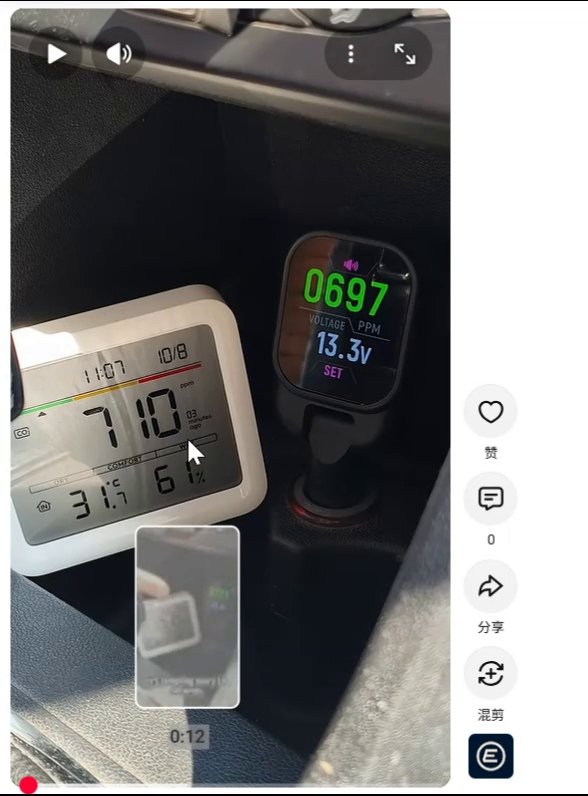
The comparison monitor showed approximately:
710 ppm
That was a relatively small difference.
This is useful because it shows that the dramatic difference later in the video was not simply present from the start.
As Cabin CO₂ Changed
The EVO-CO2V then showed approximately:
721 ppm
followed by:
746 ppm
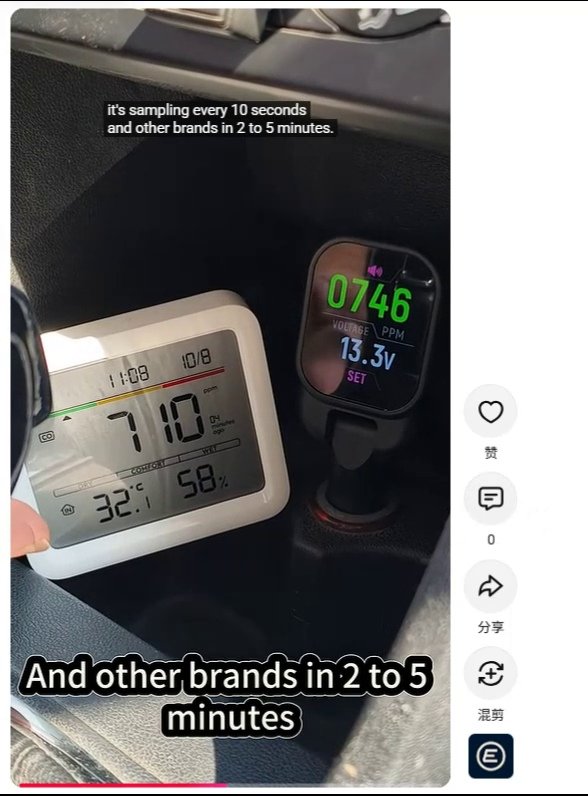
EVO-CO2V showing about 746 ppm while the comparison CO₂ monitor remained near 710 ppm during our side-by-side testLater, the display moved to approximately:
1,178 ppm
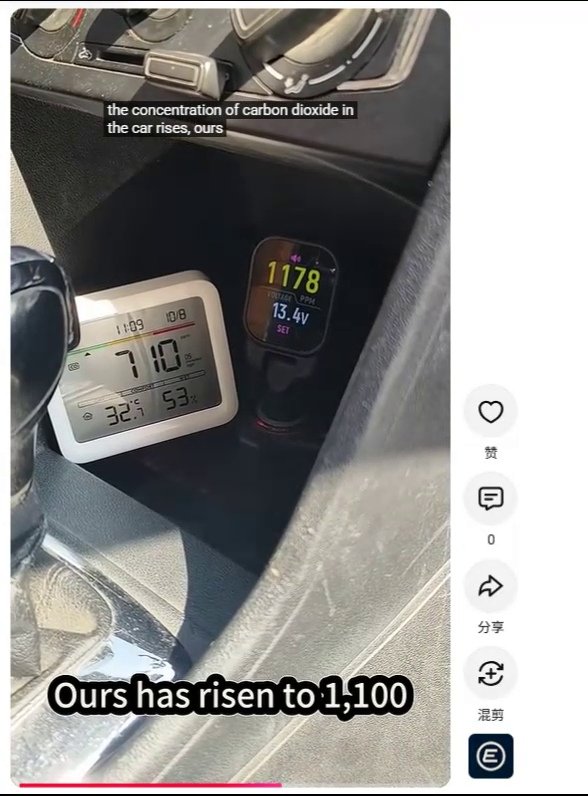
and then:
1,231 ppm
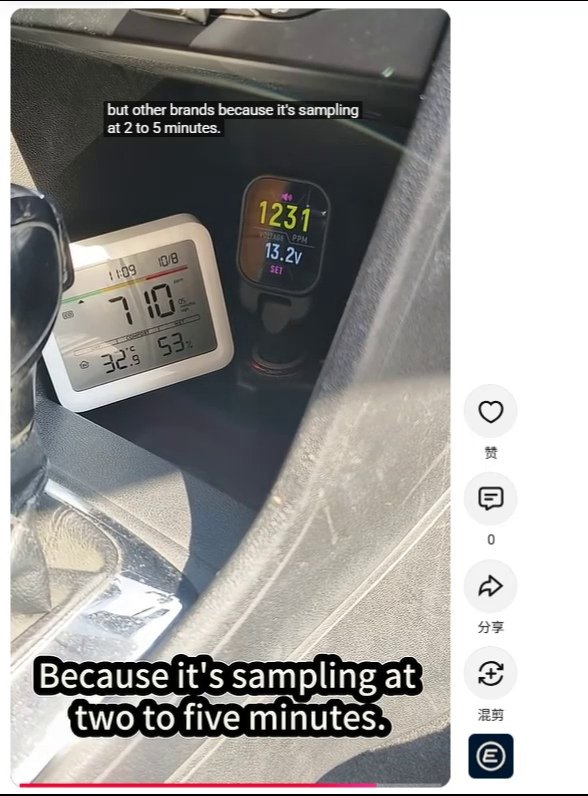
Meanwhile, the comparison monitor remained at approximately:
710 ppm
during the visible sequence.
Our direct observation is therefore:
The two displays responded differently while cabin CO₂ was changing.
Sampling Interval and Response Time Are Not the Same Thing
This distinction is important.
A sampling interval describes how often a device takes or processes a measurement.
A response time describes how quickly the sensor output responds after the actual gas concentration changes.
A device can sample frequently but still have a relatively slow physical sensor response.
Likewise, a sensor may respond quickly internally but the display may use averaging or update less frequently.
For example, Sensirion lists different minimum sampling intervals and response times across its CO₂ sensor family. Some sensors have minimum intervals of a few seconds while response times can be tens of seconds. Sensirion AG
Sensirion CO₂ sensor sampling and response-time specifications
Why Display Averaging Matters
A monitor does not necessarily show every raw sensor measurement directly.
Manufacturers may smooth or average readings to:
- reduce random fluctuations;
- create a steadier display;
- conserve power;
- avoid rapidly changing numbers.
That can make a monitor look more stable.
But during a rapidly changing environment, additional smoothing may also make the displayed value react more slowly.
This is one reason two otherwise functioning CO₂ monitors can temporarily disagree.
Vaisala notes that response time is an important sensor specification when evaluating CO₂ measurement performance. Vaisala
Vaisala explanation of CO₂ sensor response time
Why Fast Changes Matter More Inside a Car
A vehicle cabin is relatively small compared with a house, classroom or office.
With occupants inside and limited fresh-air exchange, CO₂ can change substantially over a short period.
That means a monitor’s response behavior becomes especially noticeable.
For a slowly changing room, a delayed reading may not look dramatic.
Inside a car, the difference can become much easier to see.
The EVO-CO2V is configured to sample CO₂ every 10 seconds, which is why we designed it to provide relatively frequent updates for vehicle use.
Does This Video Prove the EVO-CO2V Was More Accurate?
No.
That would require a stronger experiment.
Our video shows that the EVO-CO2V responded differently and displayed the changing concentration sooner during this sequence.
But accuracy is a separate question.
To determine which instrument was closer to the true CO₂ concentration, we would need an appropriate reference instrument or certified calibration gas.
So our conclusion is:
The EVO-CO2V display responded much more quickly to the changing cabin conditions in this recorded test.
Not:
The EVO-CO2V was proven more accurate than the other meter.
Why Two CO₂ Meters Can Disagree
Several factors can produce different readings even when monitors are close together.
These include:
- different sampling intervals;
- different response times;
- display averaging or smoothing;
- calibration differences;
- sensor technology;
- warm-up state;
- local airflow around the sensor openings;
- small differences in physical placement.
Commercial NDIR sensors themselves vary substantially in measurement frequency and response-time specifications, which illustrates why two finished products do not necessarily react identically. Sensirion AG
Placement Still Matters
Even though our two monitors were positioned close together, the air immediately around each sensor inlet may not be perfectly identical.
Inside a car there can be:
- airflow from HVAC vents;
- occupant breathing;
- warm rising air;
- small local concentration gradients.
For a more rigorous comparison, both sensor inlets should be exposed to the same well-mixed air stream.
Related Test: Recirculation vs Fresh Air
In another real driving test, we observed cabin CO₂ fall substantially after changing from recirculation toward outside-air ventilation.
Related Test: Automatic Climate Control
We also tested a vehicle in automatic climate mode while cabin CO₂ increased from approximately:
2,980 ppm
to:
3,813 ppm
Related Test: Lexus AUTO Air Intake
In our Lexus test, cabin CO₂ was around 4,300 ppm while the control panel showed:
Recirculation ON + AUTO ON + Outside Air OFF
CO₂ Is Not Carbon Monoxide
Both monitors in this experiment were being used to observe:
Carbon dioxide — CO₂
CO₂ is not the same gas as carbon monoxide — CO.
Nothing in this experiment measures vehicle exhaust safety or carbon-monoxide concentration.
What This Test Does Not Prove
This side-by-side experiment does not establish that:
- every competing CO₂ monitor behaves like the comparison device shown;
- the comparison monitor always updates slowly;
- its sampling interval is definitely 2–5 minutes;
- the EVO-CO2V was more accurate at every point;
- a faster-changing display is automatically more accurate;
- both sensor inlets experienced perfectly identical air at every instant.
Our directly visible evidence is narrower:
The displays began close together at approximately 697 and 710 ppm. As cabin CO₂ changed, the EVO-CO2V displayed values up to approximately 1,231 ppm while the comparison monitor remained near 710 ppm during the recorded sequence.
How We Would Improve This Experiment
A stronger laboratory-style comparison would place both monitors in the same controlled chamber.
We would then create a known CO₂ step change—for example from one stable concentration to another—and record:
- both displays continuously;
- exact timestamps;
- a calibrated reference CO₂ analyzer;
- temperature;
- humidity;
- airflow;
- time to reach 63% of the final change;
- time to reach 90% of the final reading.
That would let us separately measure:
accuracy
and:
response speed
instead of mixing the two concepts together.
Our Takeaway
At the start of our test, the two monitors were fairly close:
697 ppm vs 710 ppm
But as cabin CO₂ changed, their displays behaved very differently.
The EVO-CO2V moved through:
721 → 746 → 1,178 → 1,231 ppm
while the comparison monitor remained around:
710 ppm
during the recorded sequence.
So the practical lesson is:
When comparing CO₂ meters, don’t look only at whether the numbers match at one moment. Also consider how quickly each instrument responds when the actual environment changes.
Leave a Reply