Car air quality is not represented by a single number.
CO₂ can change because of occupants and ventilation. Formaldehyde and TVOC readings may behave differently because they come from different sources inside and outside the vehicle.
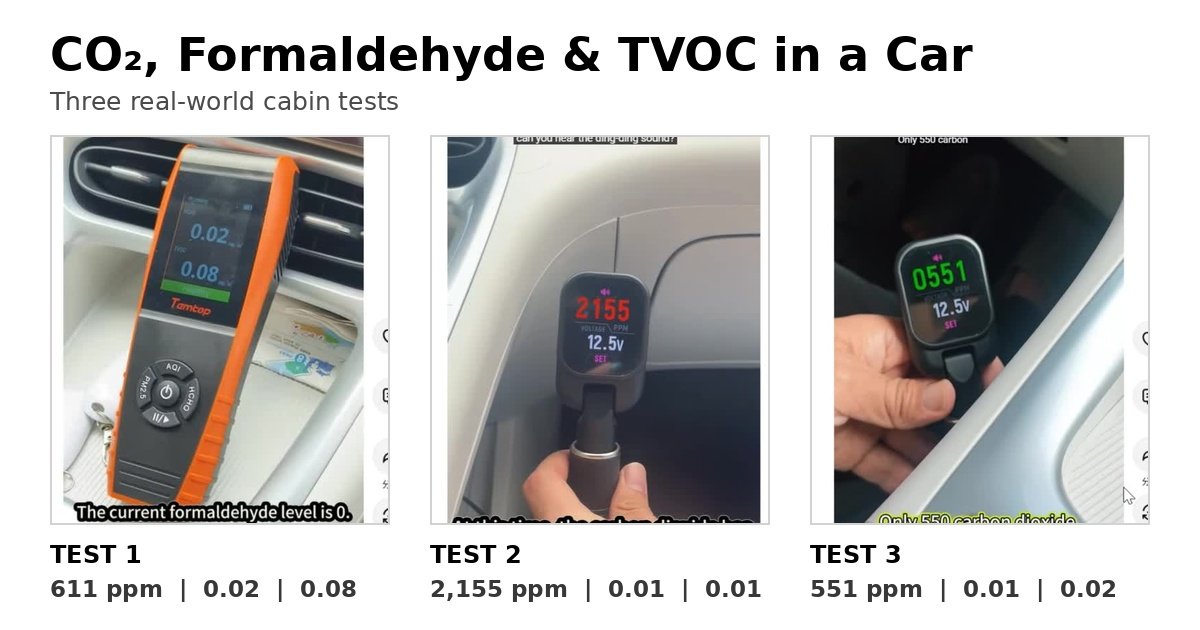
To see how these readings can differ in real driving and parking situations, our team recorded three separate car-cabin tests on October 14, 15 and 16, 2025.
Across the three tests, we observed very different combinations of CO₂, formaldehyde and TVOC readings.
Quick Answer
The three tests produced these displayed readings:
| Test condition | CO₂ | HCHO display | TVOC display |
|---|---|---|---|
| Sun-heated vehicle | 611 ppm | 0.02 | 0.08 |
| Three occupants, windows closed and recirculation | 2,155 ppm | 0.01 | 0.01 |
| Lower-reading cabin condition | 551 ppm | 0.01 | 0.02 |
The main takeaway from our tests was simple:
CO₂, formaldehyde and TVOC did not move together.
A cabin could show relatively low formaldehyde and TVOC readings while CO₂ was much higher. That is why looking at only one measurement does not describe everything happening inside a vehicle.
Test 1: A Car After Sitting in the Sun
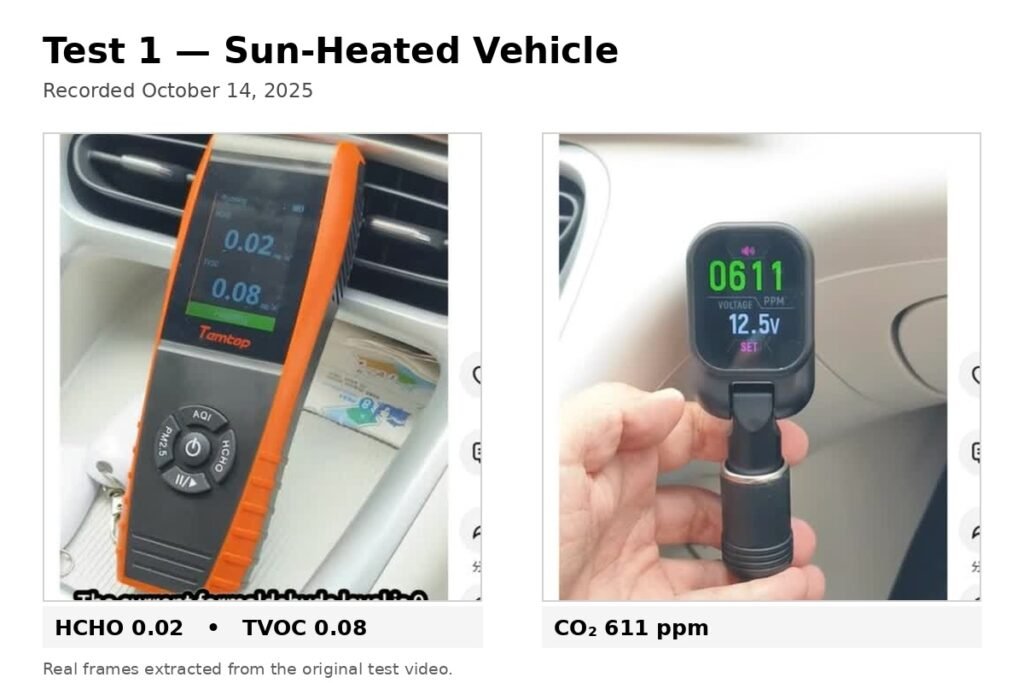
On October 14, 2025, we checked the cabin after the vehicle had been exposed to the sun.
During the recorded sequence, the displays showed approximately:
CO₂: 611 ppm
HCHO: 0.02
TVOC: 0.08
Watch the Test
The interesting part of this test was that CO₂ was relatively low compared with some of our occupied-cabin tests, while the TVOC display was higher than in the other two videos in this article.
We should not conclude from this single test that sunlight or cabin temperature directly caused the TVOC reading. Temperature, materials, ventilation history and other conditions could all influence what the monitor displays.
What we can say directly is that this particular cabin condition produced a different pollutant pattern from the other two tests.
Test 2: Three People With the Windows Closed and Recirculation On
The second test was recorded on October 15, 2025.
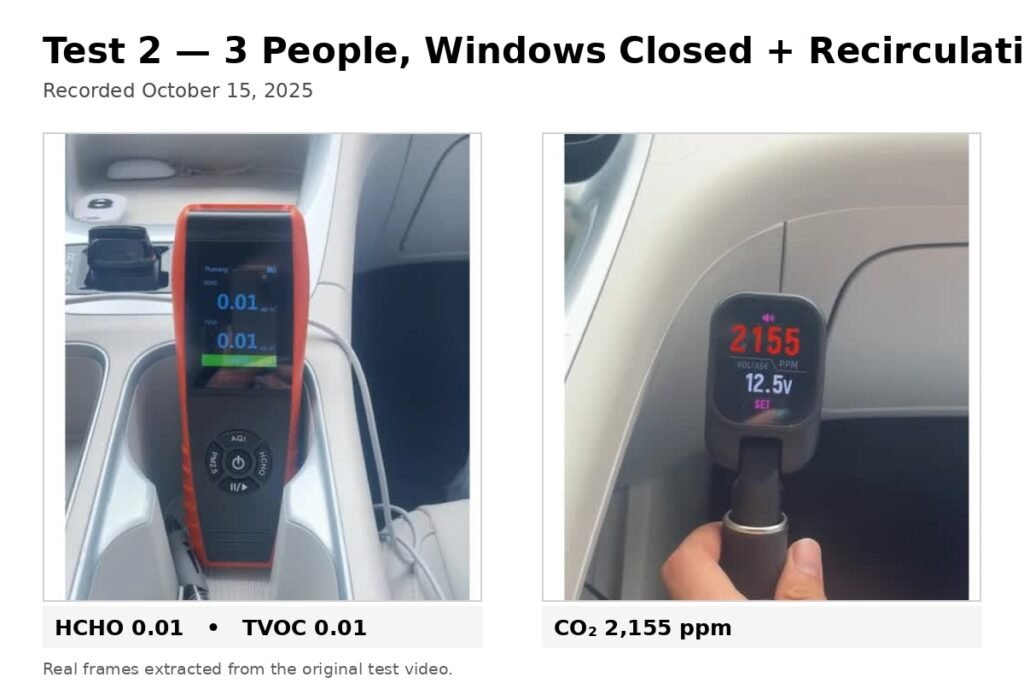
We initially ventilated the vehicle, then closed the windows and used recirculation with three people inside.
After approximately six minutes, the EVO-CO2V showed:
CO₂: approximately 2,155 ppm
At the same time, the other air-quality display showed approximately:
HCHO: 0.01
TVOC: 0.01
Watch the Test
This was one of the most useful comparisons in the three-video series.
The formaldehyde and TVOC displays remained relatively low in the recorded scene, but cabin CO₂ had increased to approximately 2,155 ppm.
That means a low HCHO or TVOC reading did not necessarily mean that cabin CO₂ was also low.
Our previous vehicle tests have shown the same general pattern: when occupants remain in a relatively enclosed cabin, CO₂ can rise noticeably.
See our related test:
Car CO₂: What Happens When You Switch From Recirculation to Fresh Air?
Why CO₂ Can Behave Differently
People continuously exhale carbon dioxide.
When several people are inside a vehicle and outside-air exchange is limited, exhaled CO₂ can accumulate in the cabin.
Formaldehyde and other VOC readings, however, are influenced by different sources and conditions.
They may be associated with interior materials, cleaning products, fragrances, outdoor pollution and other factors.
Because the sources are different, we should not expect CO₂, HCHO and TVOC readings to rise and fall together.
This second test demonstrates that point particularly clearly.
Test 3: A Lower Combined Set of Readings
Our third video was recorded on October 16, 2025.
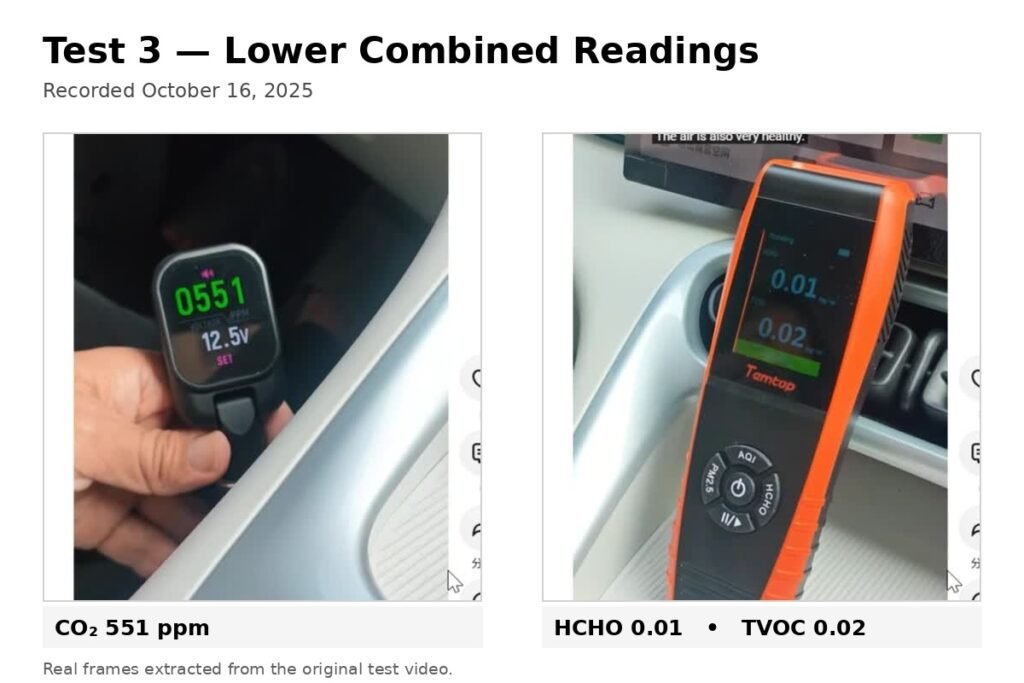
During this test, the displays showed approximately:
CO₂: 551 ppm
HCHO: 0.01
TVOC: 0.02
Watch the Test
Among these three recorded situations, this was the lowest combined set of readings shown on the instruments.
However, we do not describe this result as proof that the cabin was universally “healthy” or “safe.”
A short test measures only the parameters detected by the instruments under the conditions present at that time.
There can be other pollutants or environmental factors that these measurements do not represent.
The Most Important Comparison
The biggest lesson came from comparing the three situations side by side.
In the first test, we recorded approximately 611 ppm CO₂, while the HCHO and TVOC displays showed 0.02 and 0.08.
In the second test, cabin CO₂ reached approximately 2,155 ppm, yet the HCHO and TVOC displays were only about 0.01 and 0.01.
In the third test, the three displays showed approximately 551 ppm, 0.01 and 0.02.
The three measurements clearly did not behave as one combined “air quality score.”
They represented different aspects of the cabin environment.
Why One Air-Quality Number Is Not Enough
This is also why we are cautious about statements such as:
“The air is good.”
“The air is bad.”
“The cabin passed.”
“The cabin failed.”
Without defining exactly what is being measured, under what test method, and against which reference standard, those statements can be misleading.
A CO₂ monitor tells us about CO₂.
A formaldehyde reading tells us about what that sensor detects as formaldehyde.
A TVOC reading provides another type of information.
None of those measurements alone describes every component of vehicle cabin air.
CO₂ Is Not Carbon Monoxide
It is also important not to confuse CO₂ with CO.
The EVO-CO2V measures carbon dioxide, or CO₂.
It does not measure carbon monoxide, exhaust gases, nitrogen dioxide or every type of VOC.
A low CO₂ reading therefore should never be interpreted as proof that no other pollutant is present.
Likewise, a higher CO₂ reading does not tell us how much formaldehyde or TVOC is present.
What These Tests Do Not Prove
These three videos were real-world observations rather than laboratory-controlled experiments.
We did not use identical temperature, sunlight, ventilation history, traffic conditions or cabin conditions for all three recordings.
For that reason, the results should not be used to claim that one particular condition directly caused a specific formaldehyde or TVOC value.
What the videos do show is more straightforward:
Different cabin conditions produced different combinations of CO₂, HCHO and TVOC readings.
That observation is useful on its own.
What We Learned
Before running these tests, it would have been easy to think that all air-quality readings should rise and fall together.
Our measurements showed otherwise.
The clearest example was the three-person recirculation test. CO₂ reached approximately 2,155 ppm, while the HCHO and TVOC displays remained around 0.01.
That is why we now prefer to look at individual measurements rather than describe the entire cabin with a single air-quality number.
For vehicle CO₂ specifically, ventilation mode and the number of occupants can make a substantial difference in what we observe.
You can also see our real five-person vehicle test here:
5 People in a Car: How Fast CO₂ Rose With Recirculation
Our Takeaway
Our three real-world car tests showed that CO₂, formaldehyde and TVOC readings can tell very different stories at the same time.
In one condition, CO₂ was around 611 ppm while the TVOC display was comparatively higher.
In another, three people inside the vehicle with recirculation operating produced approximately 2,155 ppm CO₂, while the HCHO and TVOC displays remained near 0.01.
And in the third condition, all three displayed readings were comparatively lower.
For us, the practical lesson is not to rely on one number alone.
Measure the parameter you actually want to understand, and interpret it in the context of the cabin conditions at that moment.
Leave a Reply