How much solar energy can one outdoor measurement site actually receive over a full month?
During September 2026, EVO-Solar recorded 30 complete days of daily solar radiation energy (DSRE) together with solar radiation intensity (SRI) readings throughout each day.
The September dataset recorded:
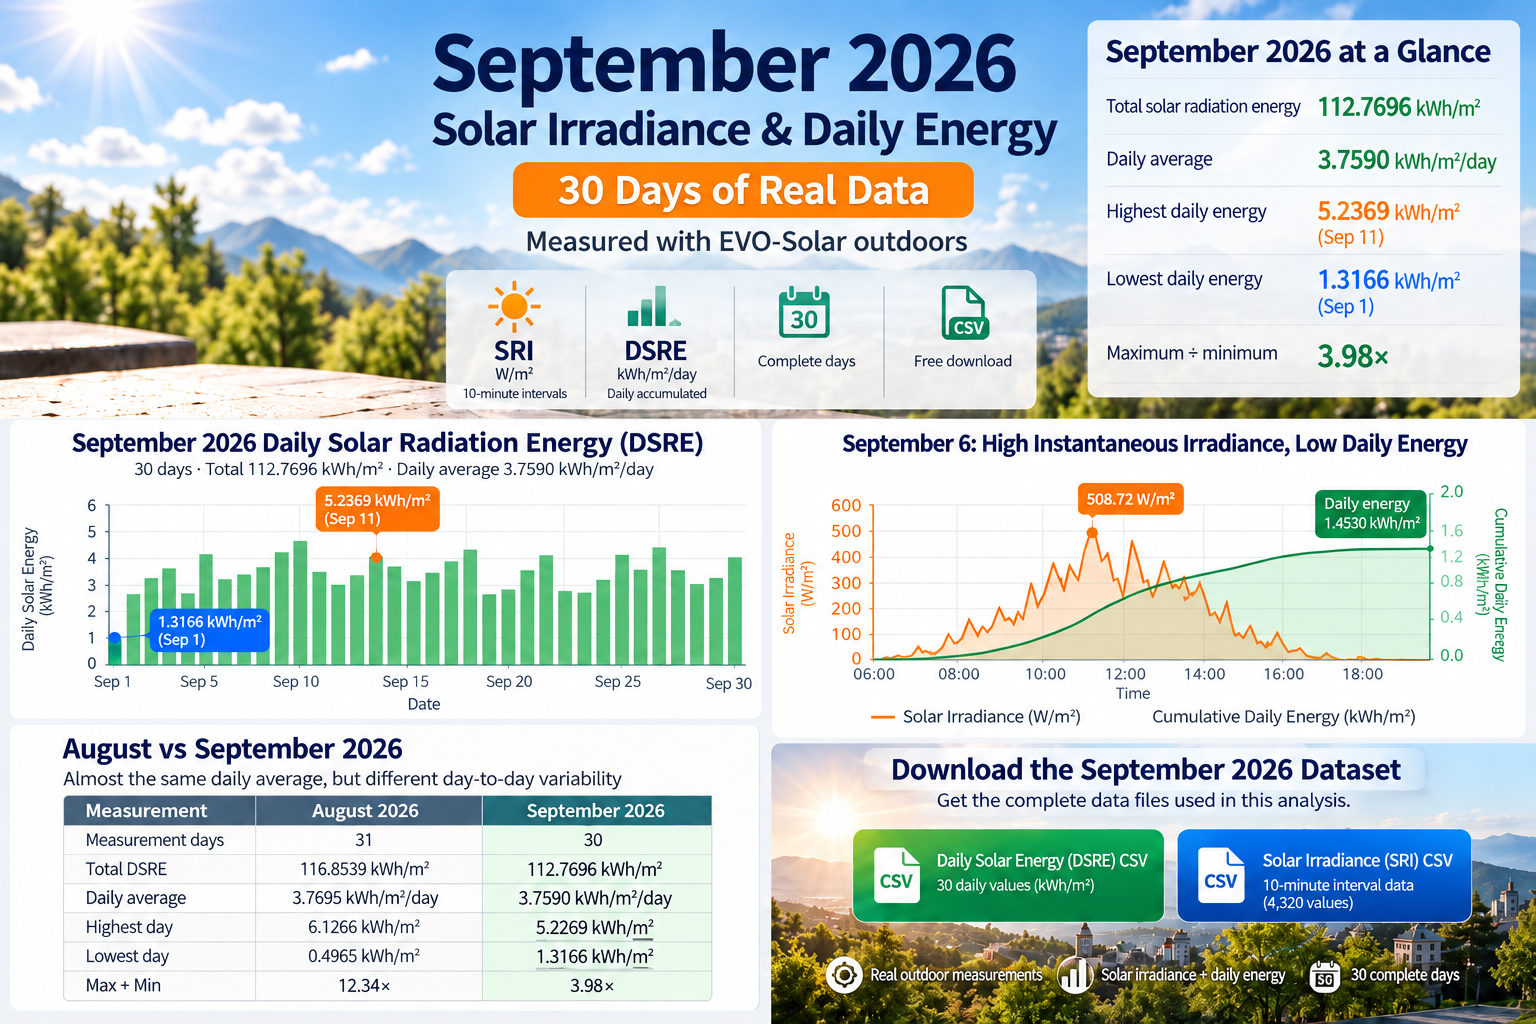
- 112.7696 kWh/m² total solar radiation energy
- 3.7590 kWh/m²/day average daily solar energy
- 5.2369 kWh/m² on the highest-energy day
- 1.3166 kWh/m² on the lowest-energy day
- A 3.98× difference between the highest and lowest days
The accompanying SRI dataset contains measurements at 10-minute intervals, providing a second view of how solar irradiance changed within each day.
September 2026 Solar Energy at a Glance
| Measurement | September 2026 Result |
|---|---|
| Complete measurement days | 30 |
| Total solar radiation energy | 112.7696 kWh/m² |
| Daily average | 3.7590 kWh/m²/day |
| Median daily energy | 4.0059 kWh/m²/day |
| Highest daily energy | 5.2369 kWh/m² |
| Highest-energy day | September 11 |
| Lowest daily energy | 1.3166 kWh/m² |
| Lowest-energy day | September 1 |
| Maximum ÷ minimum | 3.98× |
| Days ≥ 4 kWh/m² | 15 days |
| Days ≥ 5 kWh/m² | 1 day |
| Days below 2 kWh/m² | 2 days |
These values describe incoming solar radiation energy, not electrical energy produced by a photovoltaic panel.
What Did 30 Days of Daily Solar Energy Look Like?
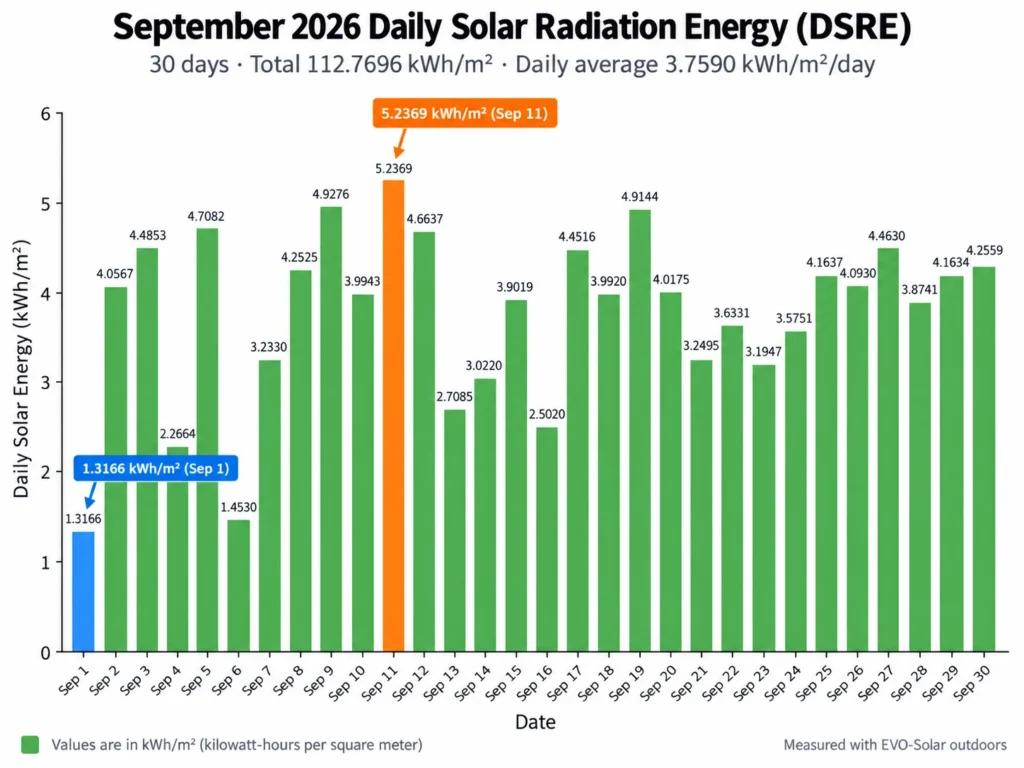
September was noticeably more consistent than the August dataset recorded in the same measurement series.
Half of the month — 15 of 30 days — recorded at least 4 kWh/m² of daily solar radiation energy.
The highest value occurred on September 11, when DSRE reached:
5.2369 kWh/m²
The lowest occurred on September 1:
1.3166 kWh/m²
That produces a maximum-to-minimum difference of approximately:
5.2369 ÷ 1.3166 = 3.98×
Even within a relatively consistent month, a single day cannot represent the solar resource available over an entire month.
Complete September 2026 Daily Solar Radiation Energy Dataset
The table below contains all 30 daily solar radiation energy measurements recorded during September 2026.
September 2026 Complete Daily Solar Radiation Energy Dataset
| Date | Daily Solar Radiation Energy |
|---|---|
| Sep 1 | 1.3166 kWh/m² |
| Sep 2 | 4.0567 kWh/m² |
| Sep 3 | 4.4853 kWh/m² |
| Sep 4 | 2.2664 kWh/m² |
| Sep 5 | 4.7082 kWh/m² |
| Sep 6 | 1.4530 kWh/m² |
| Sep 7 | 3.2330 kWh/m² |
| Sep 8 | 4.2525 kWh/m² |
| Sep 9 | 4.9276 kWh/m² |
| Sep 10 | 3.9943 kWh/m² |
| Sep 11 | 5.2369 kWh/m² |
| Sep 12 | 4.6637 kWh/m² |
| Sep 13 | 2.7085 kWh/m² |
| Sep 14 | 3.0220 kWh/m² |
| Sep 15 | 3.9019 kWh/m² |
| Sep 16 | 2.5020 kWh/m² |
| Sep 17 | 4.4516 kWh/m² |
| Sep 18 | 3.9920 kWh/m² |
| Sep 19 | 4.9144 kWh/m² |
| Sep 20 | 4.0175 kWh/m² |
| Sep 21 | 3.2495 kWh/m² |
| Sep 22 | 3.6331 kWh/m² |
| Sep 23 | 3.1947 kWh/m² |
| Sep 24 | 3.5751 kWh/m² |
| Sep 25 | 4.1637 kWh/m² |
| Sep 26 | 4.0930 kWh/m² |
| Sep 27 | 4.4630 kWh/m² |
| Sep 28 | 3.8741 kWh/m² |
| Sep 29 | 4.1634 kWh/m² |
| Sep 30 | 4.2559 kWh/m² |
Monthly total: 112.7696 kWh/m²
Daily average: 3.7590 kWh/m²/day
September 11 recorded the highest daily solar radiation energy at 5.2369 kWh/m², while September 1 recorded the lowest at 1.3166 kWh/m².
Download the September 2026 EVO-Solar Dataset
Download September 2026 Daily Solar Energy (DSRE) Excel Data
30 daily measurements · kWh/m²
Download September 2026 Solar Irradiance (SRI) Excel Data
10-minute interval measurements · W/m²
Solar Irradiance and Daily Solar Energy Tell Different Stories
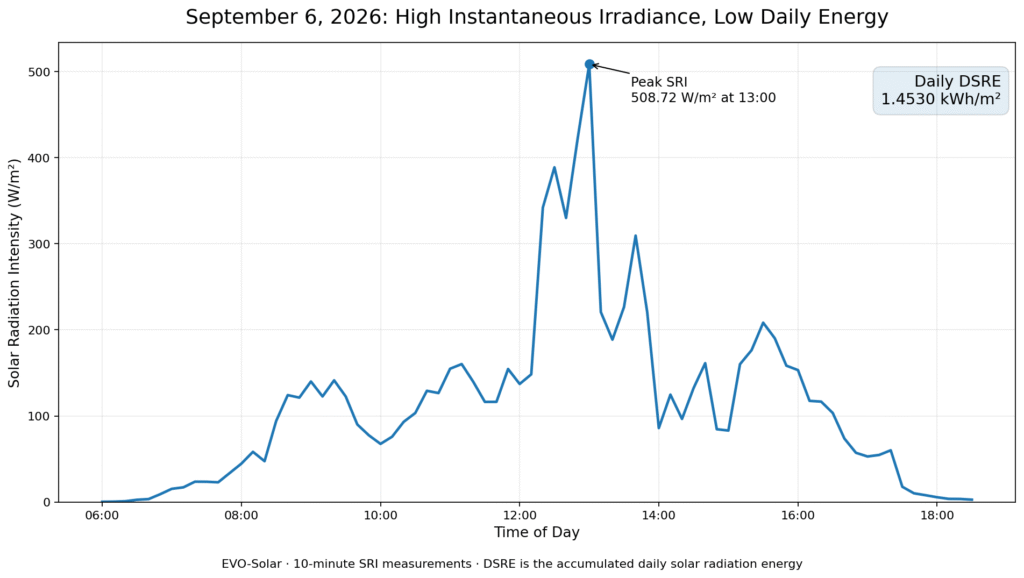
On September 6, 2026, EVO-Solar recorded a peak solar radiation intensity of 508.72 W/m² at 13:00. However, the accumulated daily solar radiation energy for the same day was only 1.4530 kWh/m².
This shows why a strong instantaneous irradiance reading does not necessarily indicate a high-energy day. Solar irradiance in W/m² describes the intensity of sunlight at a specific moment, while DSRE in kWh/m² represents the solar radiation energy accumulated across the entire day.
In other words, a site can briefly reach a relatively high irradiance level and still receive limited total solar energy if strong sunlight lasts only for a short period or if conditions change throughout the day.
Peak irradiance tells you about a moment. Daily solar energy tells you about the whole day.
EVO-Solar records two related but different measurements.
SRI — Solar Radiation Intensity (W/m²) describes the solar power reaching the measurement surface at a particular moment.
DSRE — Daily Solar Radiation Energy (kWh/m²) represents the solar radiation energy accumulated across the day.
The September dataset provides a useful example of why both measurements matter.
This illustrates an important principle:
Peak irradiance does not tell you how much solar energy a site receives across the full day.
A single midday W/m² measurement can describe that moment. It cannot replace accumulated daily energy measurements.
What Was the Highest Solar Irradiance Recorded in September?
The highest SRI value in the September export was:
653.91 W/m²
recorded on:
September 2 at 11:30
September 2 accumulated 4.0567 kWh/m² of daily solar radiation energy.
By comparison, September 11 produced the month’s highest DSRE of 5.2369 kWh/m², even though its recorded peak SRI was slightly lower at 641.33 W/m².
Again, the highest instantaneous irradiance and the highest total daily solar energy do not necessarily occur on the same day.
August and September Had Almost the Same Daily Average
The comparison with August 2026 is particularly interesting.
| Measurement | August 2026 | September 2026 |
|---|---|---|
| Measurement days | 31 | 30 |
| Total DSRE | 116.8539 | 112.7696 kWh/m² |
| Daily average | 3.7695 | 3.7590 kWh/m²/day |
| Highest day | 6.1266 | 5.2369 kWh/m² |
| Lowest day | 0.4965 | 1.3166 kWh/m² |
| Max ÷ Min | 12.34× | 3.98× |
The average daily solar radiation energy differed by only about 0.28%:
August: 3.7695 kWh/m²/day
September: 3.7590 kWh/m²/day
Yet the distribution of that energy was very different.
August ranged from 0.4965 to 6.1266 kWh/m²/day, while September stayed within a narrower range of 1.3166 to 5.2369 kWh/m²/day.
So two months can have nearly identical average solar energy while having very different day-to-day patterns.
This is one reason why an average alone does not describe the complete solar resource.
You can compare these results with our 31 Days of Real August 2026 Solar Energy Data.
What Can This Dataset Tell Us — and What Can’t It Tell Us?
The measurements show when and how much solar radiation changed.
They do not, by themselves, identify the exact cause of each change.
A lower-energy day could potentially be influenced by cloud cover, rain, atmospheric conditions, local shading, sensor orientation or other environmental factors.
Without corresponding weather and site-condition records, the solar measurements alone should not be used to assign a specific cause to an individual day’s result.
This distinction is important when interpreting real-world solar data.
Why Long-Term Solar Measurement Matters
A site can look excellent for solar at noon and still accumulate much less energy than expected across the full day.
Long-term measurement can help identify:
- day-to-day solar resource variation
- recurring periods of shade
- differences between candidate panel locations
- seasonal changes
- whether a strong instantaneous irradiance reading translates into strong accumulated energy
For site evaluation, measuring over time provides information that a single spot reading cannot.
How Were the September Measurements Recorded?
The September 2026 dataset was recorded using EVO-Solar.
EVO-Solar measures:
SRI — Solar Radiation Intensity in W/m²
and
DSRE — Daily Solar Radiation Energy in kWh/m²
The DSRE dataset contains one accumulated value for each complete day.
The SRI export contains measurements at 10-minute intervals, providing up to 144 time positions per day.
Across 30 complete September days, that creates a month-long time series of 4,320 ten-minute measurement positions.
For more information about the measurement workflow, see the EVO-Solar solar irradiance data logger page.
The Main Takeaway
September 2026 produced:
112.7696 kWh/m²
of measured incoming solar radiation energy, averaging:
3.7590 kWh/m²/day
But the more useful finding is that instantaneous solar irradiance and accumulated daily solar energy are not interchangeable measurements.
A site can reach a relatively high W/m² value during part of the day and still finish with relatively low total daily energy.
And two months can have almost identical daily averages while showing very different day-to-day variability.
Measure the moment with W/m².
Understand the day with kWh/m².
Understand the site by measuring over time.
Leave a Reply