What changed in the measured solar resource as the August–September period gave way to October?
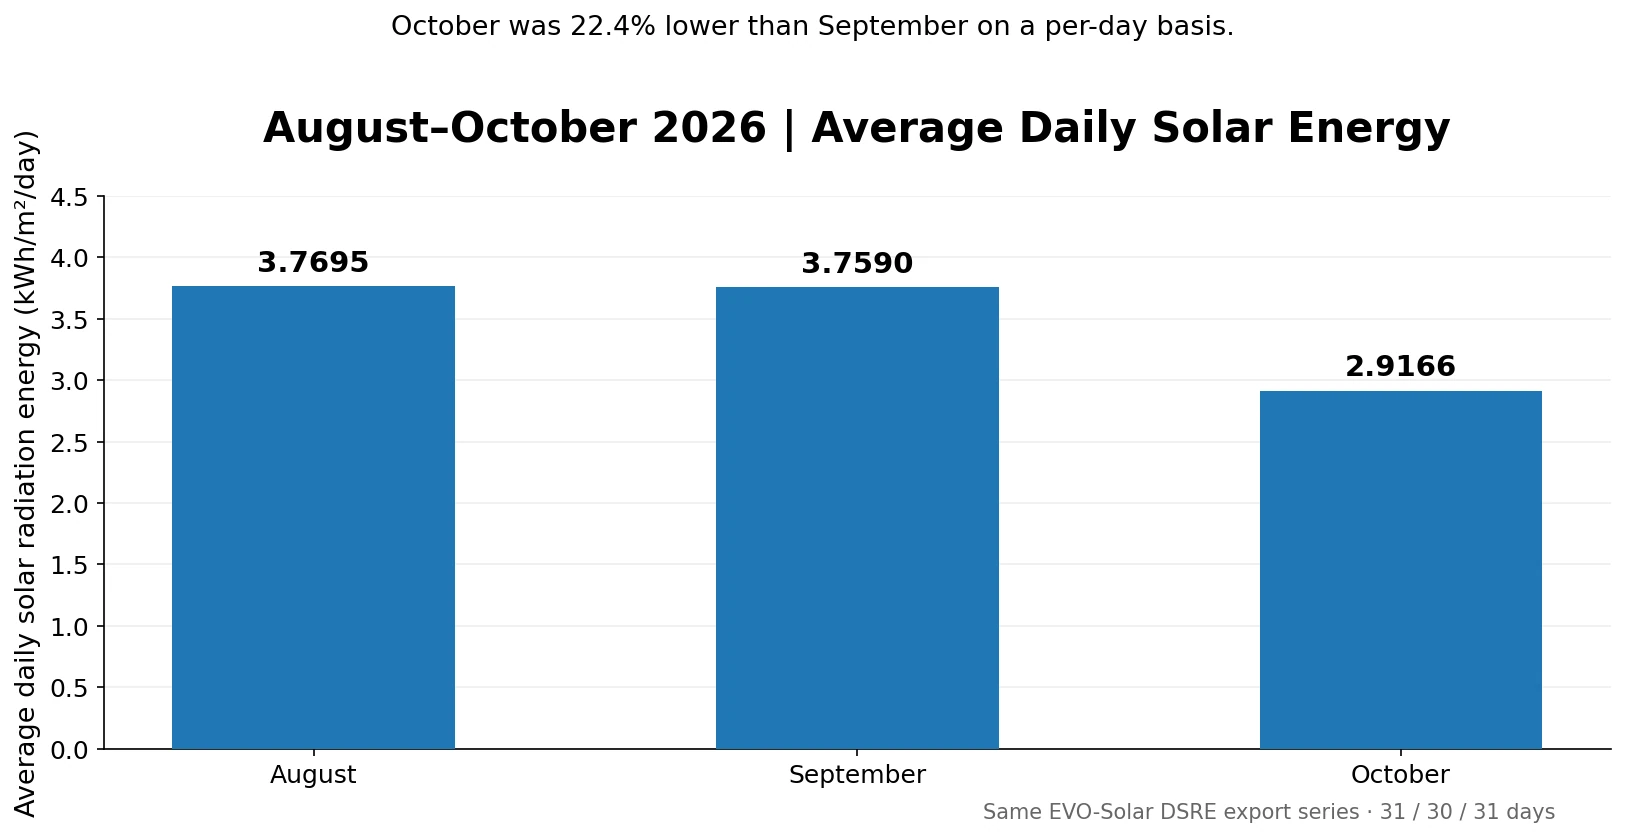
An EVO-Solar measurement export covering October 1–31, 2026 recorded 90.4150 kWh/m² of accumulated incoming solar radiation energy (DSRE). The average was 2.9166 kWh/m²/day, 22.4% lower than September’s daily average of 3.7590 kWh/m²/day.
The important result is the pattern across three complete months: August and September had almost identical daily averages, while October was substantially lower. A single momentary sunlight measurement would not show that monthly difference.
October 2026 solar energy at a glance
| Metric | October 2026 |
|---|---|
| Measurement period | October 1–31, 2026 |
| Complete DSRE days | 31 |
| Monthly accumulated solar radiation energy | 90.4150 kWh/m² |
| Average daily solar radiation energy | 2.9166 kWh/m²/day |
| Median daily solar radiation energy | 2.9890 kWh/m²/day |
| Highest daily value | 4.1296 kWh/m² (October 4) |
| Lowest daily value | 1.5774 kWh/m² (October 29) |
| Highest ÷ lowest | 2.62× |
| Days at or above 4 kWh/m² | 2 |
| Days below 2 kWh/m² | 4 |
| Highest recorded 10-minute SRI sample | 653.80 W/m² (October 23, 10:30) |
These are measurements of incoming solar radiation, not photovoltaic electricity production. DSRE is expressed in kWh/m²; electrical output depends on additional system-specific factors.
What did all 31 days of October solar energy look like?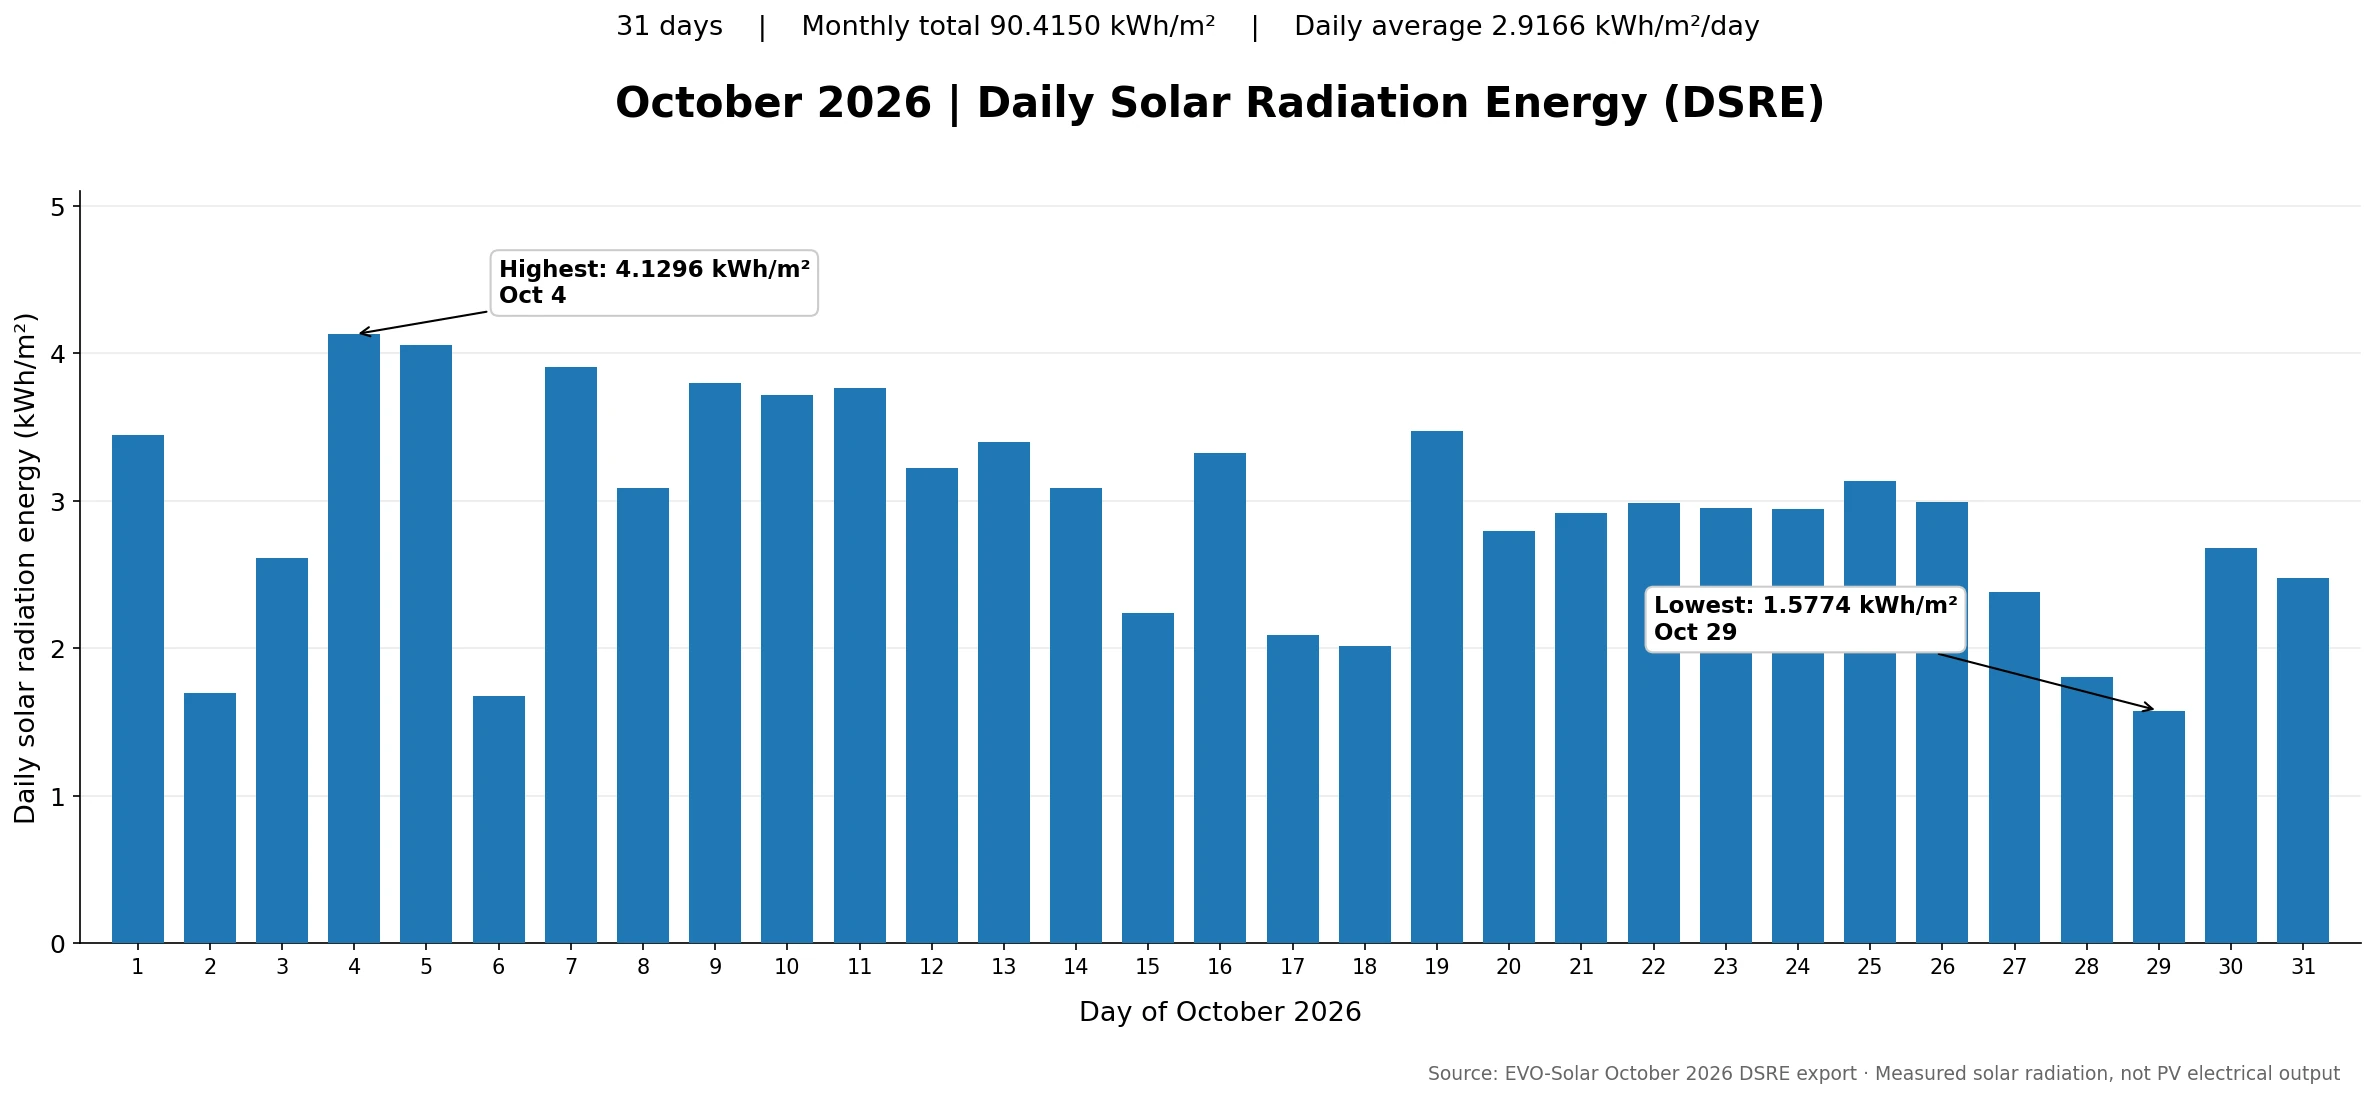
The daily-energy chart shows a broad range of outcomes across the month, even though this is one continuous export series. October 4 recorded the highest DSRE at 4.1296 kWh/m², followed by October 5 at 4.0576 kWh/m². The lowest value, 1.5774 kWh/m², occurred on October 29.
Only two days reached 4 kWh/m², compared with fifteen such days in September. This is a clearer way to explain October’s reduced solar resource than relying on a single noon irradiance reading.
Complete October 2026 daily solar radiation energy dataset
The following table reproduces all 31 daily DSRE measurements from the EVO-Solar export. Values are in kWh/m² per day.
| Date | Daily solar radiation energy (kWh/m²) |
|---|---|
| Oct 1, 2026 | 3.4468 |
| Oct 2, 2026 | 1.6941 |
| Oct 3, 2026 | 2.6122 |
| Oct 4, 2026 | 4.1296 |
| Oct 5, 2026 | 4.0576 |
| Oct 6, 2026 | 1.6750 |
| Oct 7, 2026 | 3.9077 |
| Oct 8, 2026 | 3.0844 |
| Oct 9, 2026 | 3.8027 |
| Oct 10, 2026 | 3.7171 |
| Oct 11, 2026 | 3.7679 |
| Oct 12, 2026 | 3.2214 |
| Oct 13, 2026 | 3.4024 |
| Oct 14, 2026 | 3.0899 |
| Oct 15, 2026 | 2.2418 |
| Oct 16, 2026 | 3.3271 |
| Oct 17, 2026 | 2.0876 |
| Oct 18, 2026 | 2.0143 |
| Oct 19, 2026 | 3.4734 |
| Oct 20, 2026 | 2.7968 |
| Oct 21, 2026 | 2.9195 |
| Oct 22, 2026 | 2.9890 |
| Oct 23, 2026 | 2.9552 |
| Oct 24, 2026 | 2.9458 |
| Oct 25, 2026 | 3.1375 |
| Oct 26, 2026 | 2.9933 |
| Oct 27, 2026 | 2.3839 |
| Oct 28, 2026 | 1.8062 |
| Oct 29, 2026 | 1.5774 |
| Oct 30, 2026 | 2.6809 |
| Oct 31, 2026 | 2.4765 |
Monthly total: 90.4150 kWh/m². Daily average: 2.9166 kWh/m²/day.
Download the October 2026 EVO-Solar Dataset
Download October 2026 Daily Solar Energy (DSRE) CSV
Download October 2026 Solar Irradiance (SRI) CSV
August vs September vs October: what changed?
| Metric | August 2026 | September 2026 | October 2026 |
|---|---|---|---|
| Number of days | 31 | 30 | 31 |
| Monthly DSRE (kWh/m²) | 116.8539 | 112.7696 | 90.4150 |
| Daily average (kWh/m²/day) | 3.7695 | 3.7590 | 2.9166 |
| Highest daily DSRE (kWh/m²) | 6.1266 | 5.2369 | 4.1296 |
| Lowest daily DSRE (kWh/m²) | 0.4965 | 1.3166 | 1.5774 |
| Maximum ÷ minimum | 12.34× | 3.98× | 2.62× |
August and September were surprisingly similar in average daily measured energy, differing by only about 0.28%. In October, however, the daily average dropped 22.4% relative to September and 22.6% relative to August. This comparison uses daily averages instead of monthly totals because September has 30 days while August and October each have 31.
A month-to-month decline in measured solar energy can be associated with changes in solar geometry, local weather, shadows, surface orientation, or a combination of factors. These exports do not establish the exact cause of the change.
What did October’s 10-minute solar irradiance readings show?
In addition to DSRE, the SRI spreadsheet provides 144 timestamped ten-minute positions per day. For October’s 31 days, that is 4,464 recorded SRI values, including night-time readings. SRI measures an irradiance reading at a moment and is expressed in W/m².
The highest October SRI sample was 653.80 W/m² on October 23 at 10:30. Yet October 23 accumulated 2.9552 kWh/m² of DSRE. By contrast, October 4 recorded the month’s highest DSRE of 4.1296 kWh/m², while its highest SRI sample was 649.37 W/m².
This comparison demonstrates why the highest sampled irradiance reading should not be treated as a substitute for the full-day accumulated energy result. Peak irradiance describes a moment; DSRE describes an accumulated daily quantity.
What does the October dataset mean for solar site assessment?
Solar panel placement decisions benefit from measurements over many days, not just a single sunny afternoon. A spot reading in W/m² may show the current intensity, while a daily DSRE record makes it easier to compare the amount of incoming solar energy accumulated over time.
For rooftop, yard, carport, RV, and off-grid planning, a multi-week dataset can help identify lower-energy periods and support comparisons between candidate locations or sensor orientations. It does not replace photovoltaic performance modeling, electrical output measurement, or a long-term climatological assessment.
Measurement method and limitations
The analysis uses two EVO-Solar exports: a DSRE file with one daily energy result per date and an SRI file with readings at ten-minute timestamp positions. The October daily-energy totals shown above are taken directly from the DSRE export; they have not been reconstructed by integrating the ten-minute SRI samples. The files do not establish the site coordinates, sensor orientation, weather conditions, or timestamp timezone.
The observations describe this measurement series, not an expected energy yield for a whole region, and no panel electrical energy was measured. The specific causes of low and high days are not identified from the radiation exports alone.
Related EVO-Solar field measurements
For more context, compare the August 2026 31-day EVO-Solar dataset and the September 2026 solar irradiance and daily energy study. Learn how SRI, DSRE, historical records, and data export work on the EVO-Solar product page.
Frequently asked questions
How much solar radiation energy was recorded in October 2026?
The 31 daily EVO-Solar DSRE records total 90.4150 kWh/m², averaging 2.9166 kWh/m²/day.
How did October compare with September?
October’s average daily DSRE was 22.4% lower than September’s, even though October contained one more calendar day.
Does the dataset show how much electricity a solar panel generated?
No. EVO-Solar records incoming solar radiation intensity and accumulated solar radiation energy. It does not directly record PV panel electrical output, voltage, current, or conversion efficiency.
The main takeaway
Three complete months of measurements reveal an important pattern: August and September delivered nearly the same average daily solar radiation energy, but October delivered substantially less. The October records also show that daily solar resources can vary even within a single month.
Measure the moment with W/m². Understand the day with kWh/m². Evaluate the site with longer-term data.
Leave a Reply