Daily solar energy can vary far more than a sunny afternoon might suggest.
At the same measurement site during August 2026, daily incoming solar radiation energy ranged from 0.4965 to 6.1266 kWh/m²/day.
That means the highest-energy day received approximately 12.34 times as much solar radiation energy as the lowest-energy day.
Across the full 31 days, the site received:
| August 2026 measurement | Result |
|---|---|
| Measurement days | 31 |
| Total solar radiation energy | 116.8539 kWh/m² |
| Daily average | 3.7695 kWh/m²/day |
| Highest daily value | 6.1266 kWh/m² |
| Highest day | August 10 |
| Lowest daily value | 0.4965 kWh/m² |
| Lowest day | August 30 |
| Maximum ÷ minimum | 12.34× |
| Days ≥ 4 kWh/m² | 14 days |
| Days ≥ 5 kWh/m² | 9 days |
| Days below 2 kWh/m² | 4 days |
These measurements describe incoming solar radiation energy, not the electrical energy produced by a photovoltaic panel.
What Did 31 Days of August Solar Energy Look Like?
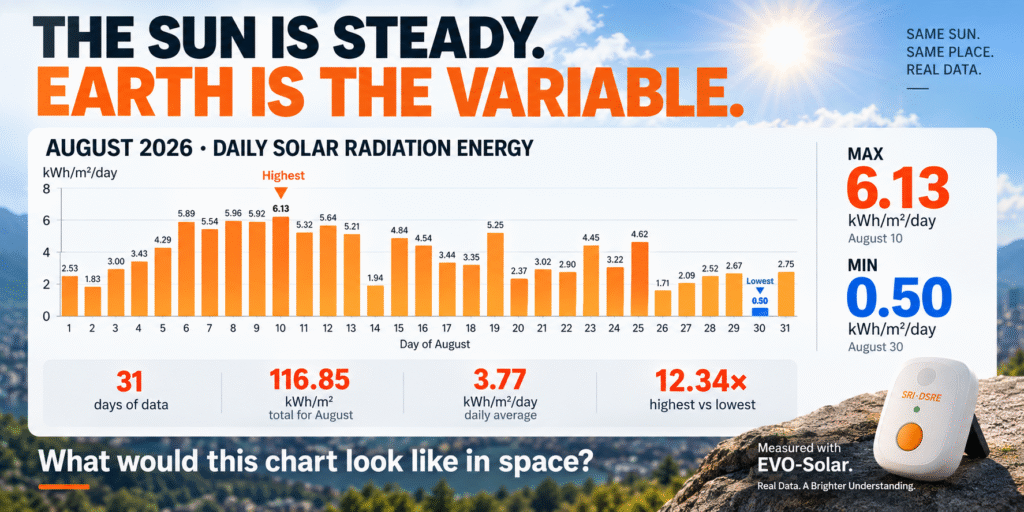
The chart shows that solar energy did not arrive at a constant rate throughout the month.
August 6 through August 13 produced an especially strong run, with eight consecutive days above 5 kWh/m²/day.
The highest daily value occurred on August 10 at 6.1266 kWh/m².
But later in the same month, August 30 recorded only 0.4965 kWh/m².
The important point is not simply that one day was sunny and another was not.
It is that a site that appears to have excellent solar exposure can still experience substantial day-to-day variation when solar energy is measured over complete days instead of at one moment.
The Highest August Day Received 12.34× More Solar Energy Than the Lowest
The difference between the maximum and minimum measurements is especially useful for understanding solar variability.
6.1266 ÷ 0.4965 = 12.34
So within a single calendar month, at the same measurement site, the highest daily solar radiation energy was approximately 12.34 times the lowest.
A single instantaneous measurement would not show this pattern.
For example, measuring solar irradiance at noon can tell you what is happening at that moment. It cannot tell you how much solar energy the same location will accumulate across the entire day—or across the next 31 days.
Why Can Daily Solar Energy Change So Much?
Ground-level solar radiation is affected by many changing conditions.
Cloud cover, rain, atmospheric conditions, recurring shade from trees or buildings, solar angle, season and the measurement surface orientation can all influence the solar energy reaching a particular location.
However, there is an important limitation when interpreting this dataset:
The DSRE data shows when solar energy changed, but it does not by itself identify the exact cause of each change.
For example, the August 30 value of 0.4965 kWh/m² tells us that the measured daily solar resource was unusually low compared with most of the month. The measurement alone cannot tell us whether that particular result was caused by clouds, rain, shading or another environmental factor.
That distinction matters when solar data is used for engineering or site-planning decisions.
Solar Irradiance and Daily Solar Energy Are Not the Same Measurement
Two measurements are useful when evaluating sunlight over time.
Solar irradiance, expressed in W/m², describes the instantaneous solar power reaching a surface.
Daily solar radiation energy, expressed in kWh/m², describes the solar energy accumulated over time.
A site could produce a strong W/m² reading around midday while still receiving relatively little total energy that day because of morning cloud, afternoon shade or other changing conditions.
That is why long-term solar measurement can reveal information that a single spot reading cannot.
For a detailed explanation of real-time SRI and accumulated DSRE measurements, see the EVO-Solar solar irradiance data logger page.
What Does This Mean for Solar Site Planning?
The August data illustrates why solar-system planning should not depend on one sunny-day measurement.
If two roofs, yards, sheds, RV parking locations or panel positions appear equally sunny at one moment, they may still accumulate different amounts of solar radiation over complete days.
Longer-term monitoring can help answer questions such as:
Which location consistently receives more solar energy?
When does recurring shade begin to affect the site?
How different are clear days and low-energy days?
Does a site that looks bright at noon remain productive across the full day?
These measurements do not replace photovoltaic system calculations. Actual PV electrical output also depends on panel efficiency, temperature, inverter performance, wiring, orientation, battery conditions and other system factors.
Solar radiation data provides the solar-resource side of the picture.
You can also compare solar measurement with other outdoor measurement methods in the:
Plant & Outdoor Measurement Guide
Would Solar Energy Be This Variable in Space?
This August dataset measures solar radiation on Earth, so it cannot tell us what a particular orbital solar system would produce.
But it helps illustrate why space-based solar power is interesting.
Ground measurements are affected by conditions between the Sun and the measurement surface, including atmosphere, clouds, weather and local shading.
Above most of Earth’s atmosphere, incoming sunlight is much more stable. Space solar systems, however, would still not produce a perfectly flat chart. Their exposure can depend on orbit, periods spent in Earth’s shadow, spacecraft orientation, thermal conditions and system design.
So the correct comparison is not:
“Solar energy is perfectly constant in space.”
It is:
“Removing many Earth-based variables can make the available solar resource considerably more consistent.”
NASA’s long-term satellite measurements also show that the Sun itself is not perfectly constant, although its variation is small compared with the dramatic ground-level variation seen in this August dataset. NASA reports total solar irradiance near Earth at roughly 1361 W/m² and describes relatively small long-term solar variability.
The U.S. Department of Energy similarly notes that terrestrial solar collection is reduced by factors including night, cloud cover, atmosphere and seasonality.
How Were These Measurements Recorded?
The dataset consists of 31 daily DSRE records from August 1 through August 31, 2026.
Measurements were recorded using EVO-Solar, a solar irradiance data logger designed to record:
SRI — Solar Radiation Intensity in W/m²
and
DSRE — Daily Solar Radiation Energy in kWh/m²
EVO-Solar stores historical measurements so that solar conditions can be reviewed over days and months rather than relying only on an instantaneous reading.
This article analyzes the recorded DSRE values from one complete month.
Complete August 2026 Dataset
Download the Complete August 2026 EVO-Solar Dataset (CSV)
Contains all 31 daily solar radiation energy measurements used in this analysis.
| Date | Daily Solar Radiation Energy |
|---|---|
| Aug 1 | 2.5267 kWh/m² |
| Aug 2 | 1.8321 kWh/m² |
| Aug 3 | 3.0006 kWh/m² |
| Aug 4 | 3.4294 kWh/m² |
| Aug 5 | 4.2885 kWh/m² |
| Aug 6 | 5.8901 kWh/m² |
| Aug 7 | 5.5383 kWh/m² |
| Aug 8 | 5.9595 kWh/m² |
| Aug 9 | 5.9208 kWh/m² |
| Aug 10 | 6.1266 kWh/m² |
| Aug 11 | 5.3170 kWh/m² |
| Aug 12 | 5.6441 kWh/m² |
| Aug 13 | 5.2069 kWh/m² |
| Aug 14 | 1.9420 kWh/m² |
| Aug 15 | 4.8419 kWh/m² |
| Aug 16 | 4.5353 kWh/m² |
| Aug 17 | 3.4353 kWh/m² |
| Aug 18 | 3.3524 kWh/m² |
| Aug 19 | 5.2477 kWh/m² |
| Aug 20 | 2.3687 kWh/m² |
| Aug 21 | 3.0187 kWh/m² |
| Aug 22 | 2.9010 kWh/m² |
| Aug 23 | 4.4462 kWh/m² |
| Aug 24 | 3.2234 kWh/m² |
| Aug 25 | 4.6160 kWh/m² |
| Aug 26 | 1.7075 kWh/m² |
| Aug 27 | 2.0939 kWh/m² |
| Aug 28 | 2.5223 kWh/m² |
| Aug 29 | 2.6717 kWh/m² |
| Aug 30 | 0.4965 kWh/m² |
| Aug 31 | 2.7528 kWh/m² |
Monthly total: 116.8539 kWh/m²
Daily average: 3.7695 kWh/m²/day
Frequently Asked Questions
How much solar radiation energy was recorded during August 2026?
The 31 daily measurements totaled 116.8539 kWh/m².
What was the average daily solar energy?
The average was 3.7695 kWh/m²/day across all 31 days.
How much did daily solar energy vary?
The highest day measured 6.1266 kWh/m², while the lowest measured 0.4965 kWh/m². The maximum was approximately 12.34 times the minimum.
Does EVO-Solar measure electricity generated by a solar panel?
No. EVO-Solar measures incoming solar radiation. It does not measure panel voltage, current or electrical watt output.
Can one sunny-day measurement represent the solar potential of a site?
Not reliably. A spot measurement describes conditions at one moment. Multi-day accumulated solar-energy measurements can reveal weather, shade and other variations that are not visible from a single reading.
The Main Takeaway
August 2026 produced 116.85 kWh/m² of measured solar radiation energy at this site.
But the monthly total hides an important detail:
Daily solar energy ranged from only 0.50 to 6.13 kWh/m²—more than a 12× difference within the same month.
For solar planning, the lesson is simple:
Measure over time, not just at one moment.
Learn more about long-term solar irradiance and daily solar energy measurement with EVO-Solar.
Leave a Reply