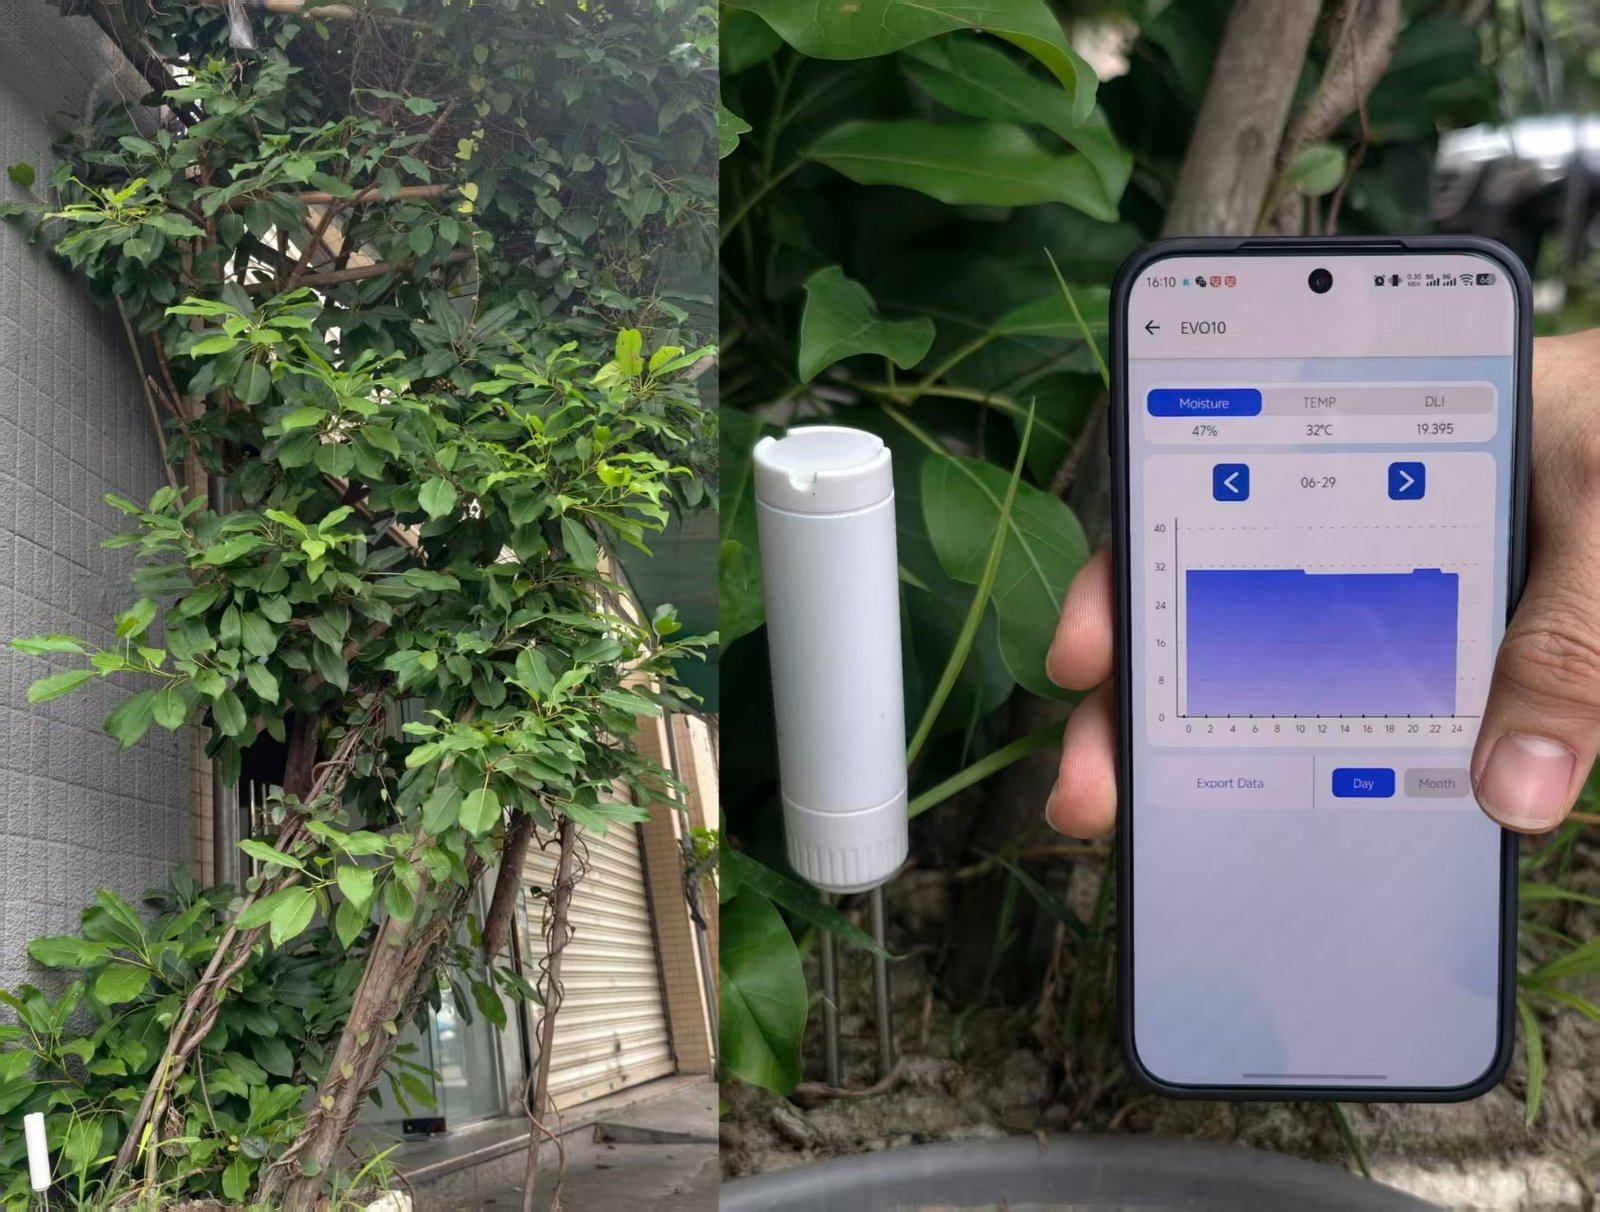
In one fixed outdoor installation, EVO10 recorded 16,710 paired soil moisture and root-zone temperature readings at ten-minute intervals from May 29 to September 22, 2026.
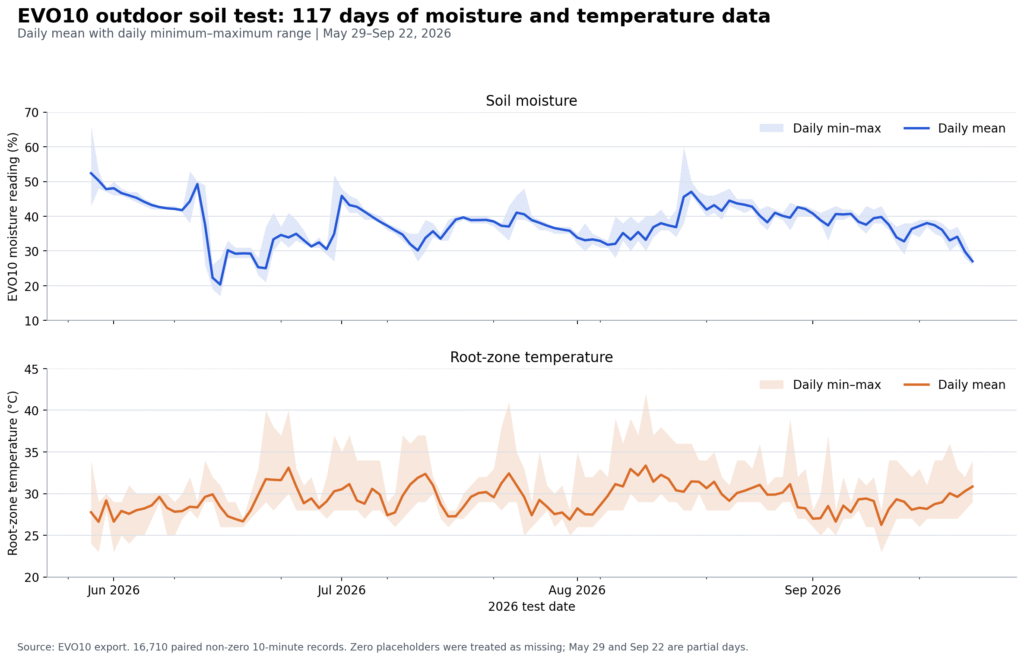
Across the analyzed record, the median moisture reading was 38%, while the median root-zone temperature was 29°C. More importantly, the historical data revealed gradual dry-back, abrupt wetting events, and temperature changes that a single spot check would miss.
Test at a Glance
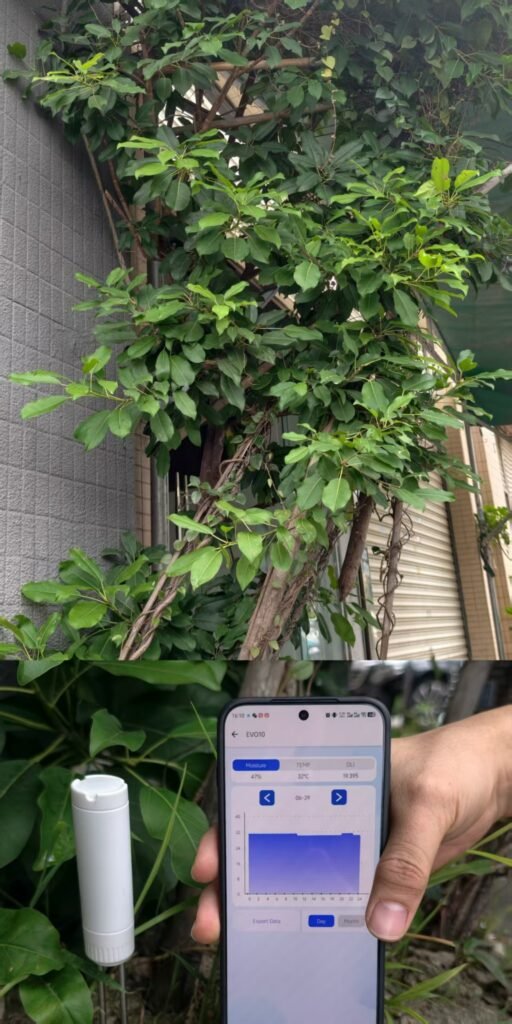
- Test setting: An outdoor container tree beside a concrete wall
- Sensor position: One fixed location near the root zone
- Monitoring period: May 29, 2026 at 14:40 to September 22, 2026 at 18:20
- Calendar span: 117 days
- Sampling interval: 10 minutes
- Valid paired readings: 16,710
- Moisture reading: Median 38%; observed range 17%–66%
- Root-zone temperature: Median 29°C; observed range 23°C–42°C
The source file also contained a short April 27–30 data block followed by a 28-day gap. We excluded that block rather than imply that it belonged to the same continuous outdoor deployment.
Exported zero values were treated as missing placeholders, not as real 0% moisture or 0°C temperature measurements. May 29 and September 22 were partial recording days.
The moisture percentages in this article are EVO10 readings from one soil, one plant, and one fixed sensor position. They are not presented as laboratory-verified volumetric water content and should not be used as a universal watering threshold for every plant or growing medium.
What Did the 117-Day Soil Record Show?
1. Dry-Back Was Visible Between Wetting Events
The moisture curve did not remain at one level. It generally moved downward between sudden increases, showing how water conditions changed around the fixed sensing area.
One clear dry-back period occurred in June. The daily mean moisture reading was 49.3% on June 12 and fell to 20.3% by June 15. The lowest individual reading on June 15 was 17%.
The data alone cannot divide that decline among drainage, evaporation, root uptake, and local changes around the probes. It does, however, make the rate and direction of change visible.
That is the main advantage of leaving a soil moisture monitor in one location. A handheld check could show 49% or 20% at one moment, but it would not show the path between them.
2. Wetting Events Appeared as Sharp Steps
The strongest ten-minute moisture increase in the analyzed period occurred on June 30:
- 15:50: 28%
- 16:00: 48%
- Change: 20 percentage points in 10 minutes
This type of abrupt increase is consistent with water reaching the sensing zone.
Because the test did not include a separate rainfall or irrigation log, the data cannot determine whether the water came from rain or manual watering. The sensor records the soil response, while an event log is needed to explain the cause.
For future monitoring, recording each watering or rainfall event would make the history more useful. It would allow the grower to compare:
- How quickly water reaches the installed probes
- How high the moisture reading rises
- How long the root zone remains wet
- How quickly the soil returns to its earlier level
3. Root-Zone Temperature Changed Substantially
Across all paired records, root-zone temperature ranged from 23°C to 42°C.
The hottest day by daily mean was August 10:
- Daily mean: 33.4°C
- Daily minimum: 29°C
- Daily maximum: 42°C
A temperature peak does not by itself prove that roots were damaged. Plant species, exposure duration, soil structure, moisture, sensor depth, and root location all affect the biological result.
The data does show why local root-zone measurement provides information that a weather-app temperature cannot. A weather service reports ambient conditions at a different measurement point. It cannot show the exact conditions around one outdoor container or root zone.
The most useful approach is to review moisture and temperature together. Hotter periods may coincide with faster dry-back, while a wetting event may affect both measurements.
Why One Moisture Number Is Not a Universal Watering Rule
The overall median moisture reading was 38%, but 38% should not become a watering rule for every plant.
Soil texture, salinity, organic matter, bulk density, roots, probe contact, container size, and sensor position can all influence a soil moisture reading.
University of Minnesota Extension also notes that soil conditions can affect sensor response and that site- or soil-specific calibration may be preferred for some sensor types.
A more practical method is to establish a baseline in the actual growing setup:
- Install the sensor in a representative part of the root zone.
- Keep the sensor in a consistent position.
- Record the reading after thorough watering and normal drainage.
- Watch how quickly the moisture value falls over the following days.
- Compare the curve with the plant’s appearance and root-zone condition.
- Choose a watering trigger from repeated observations rather than a generic percentage found online.
This approach turns the reading into a reference for that plant, soil, container, and sensor position.
Why the Trend Matters More Than One Reading
A spot reading answers one question:
What does the sensor report right now?
A fixed-position history can answer more useful questions:
- How long does the root zone stay wet after water arrives?
- How many days does it take to return to its usual dry range?
- Does the soil dry faster during hotter periods?
- Does water reach the sensor quickly or gradually?
- Is the current watering cycle similar to earlier cycles?
- Is the root zone staying wet longer than expected?
The June 30 event illustrates the difference. If the sensor had been checked only at 15:50, the result would have been 28%. Ten minutes later, it was 48%.
Neither value alone explains what happened. The time series does.
The USDA Climate Hubs similarly notes that soil moisture monitoring allows growers to assign numbers to their observations and track the effects of rainfall and irrigation over time.
What This Test Does and Does Not Demonstrate
This is an original field dataset from a real outdoor installation, but it is not a laboratory calibration study.
The Test Demonstrates
- Fixed-position soil moisture and temperature recording
- Ten-minute historical measurements
- Long-term dry-back and wetting patterns
- Daily and seasonal root-zone temperature changes
- Spreadsheet export for deeper data analysis
The Test Does Not Establish
- Absolute volumetric water content accuracy against a laboratory reference
- One moisture percentage that applies to every plant or soil
- Whether every wetting event resulted from rain or irrigation
- A universal root-zone temperature stress threshold
These limitations do not reduce the value of the history. They define how the data should be used: to understand the behavior of a specific root zone under consistent sensor placement.
How EVO10 Supports Long-Term Root-Zone Monitoring
The EVO10 Smart Soil Monitor is designed to remain installed in the soil and record moisture and root-zone temperature over time.
After the initial setup, the phone does not need to remain connected. Users can reconnect by Bluetooth to read the sensor, review stored daily or monthly curves, and export historical data for spreadsheet analysis.
This makes it possible to move beyond isolated readings and build a record of how one plant’s root zone responds to watering, weather, temperature, and seasonal change.
For a broader explanation of plant and outdoor measurements, visit the Plant & Outdoor Measurement Guide.
Frequently Asked Questions
What did EVO10 record in this outdoor test?
The analyzed deployment produced 16,710 paired ten-minute records from May 29 to September 22, 2026. Median moisture was 38%, with an observed range of 17%–66%. Median root-zone temperature was 29°C, with an observed range of 23°C–42°C.
Does a 38% soil moisture reading mean every plant should be watered?
No. The same percentage can have different meanings in different soils, growing media, containers, sensor positions, and root systems. Repeated readings from the same installation should be used to establish the plant’s own wet and dry baseline.
Can a soil moisture sensor distinguish rainfall from irrigation?
The sensor can show when water reaches the sensing area, but the moisture curve alone cannot identify the water source. A separate rainfall and watering log is required.
Why measure root-zone temperature instead of using weather data?
Weather data describes ambient conditions at another location. Root-zone temperature reflects the local environment around the installed sensor, which may be affected by direct sunlight, surrounding surfaces, container material, soil moisture, and shading.
Does the phone need to remain connected to EVO10?
No. After setup, EVO10 records independently. Users can reconnect by Bluetooth when they want to read the device, review its stored history, or export data.
Sources
- EvoDevice, original EVO10 field export, May 29–September 22, 2026.
- EVO10 Smart Soil Monitor, EvoDevice.
- Soil Moisture Sensors for Irrigation Scheduling, University of Minnesota Extension.
- Soil Moisture Sensors: A Tool for Smart Irrigation Management Decisions, USDA Climate Hubs.
Leave a Reply