Total PAR / PPFD
Measure the combined photosynthetic photon flux density at the measurement point.
X100 combines total PAR/PPFD, UVA irradiance and separate red, green and blue PAR components in one app-connected measurement workflow. Estimate DLI, map fixture uniformity and export XLSX data for deeper comparison.
Built for grow-light checks, fixture comparison, grid measurement and data-driven lighting decisions.
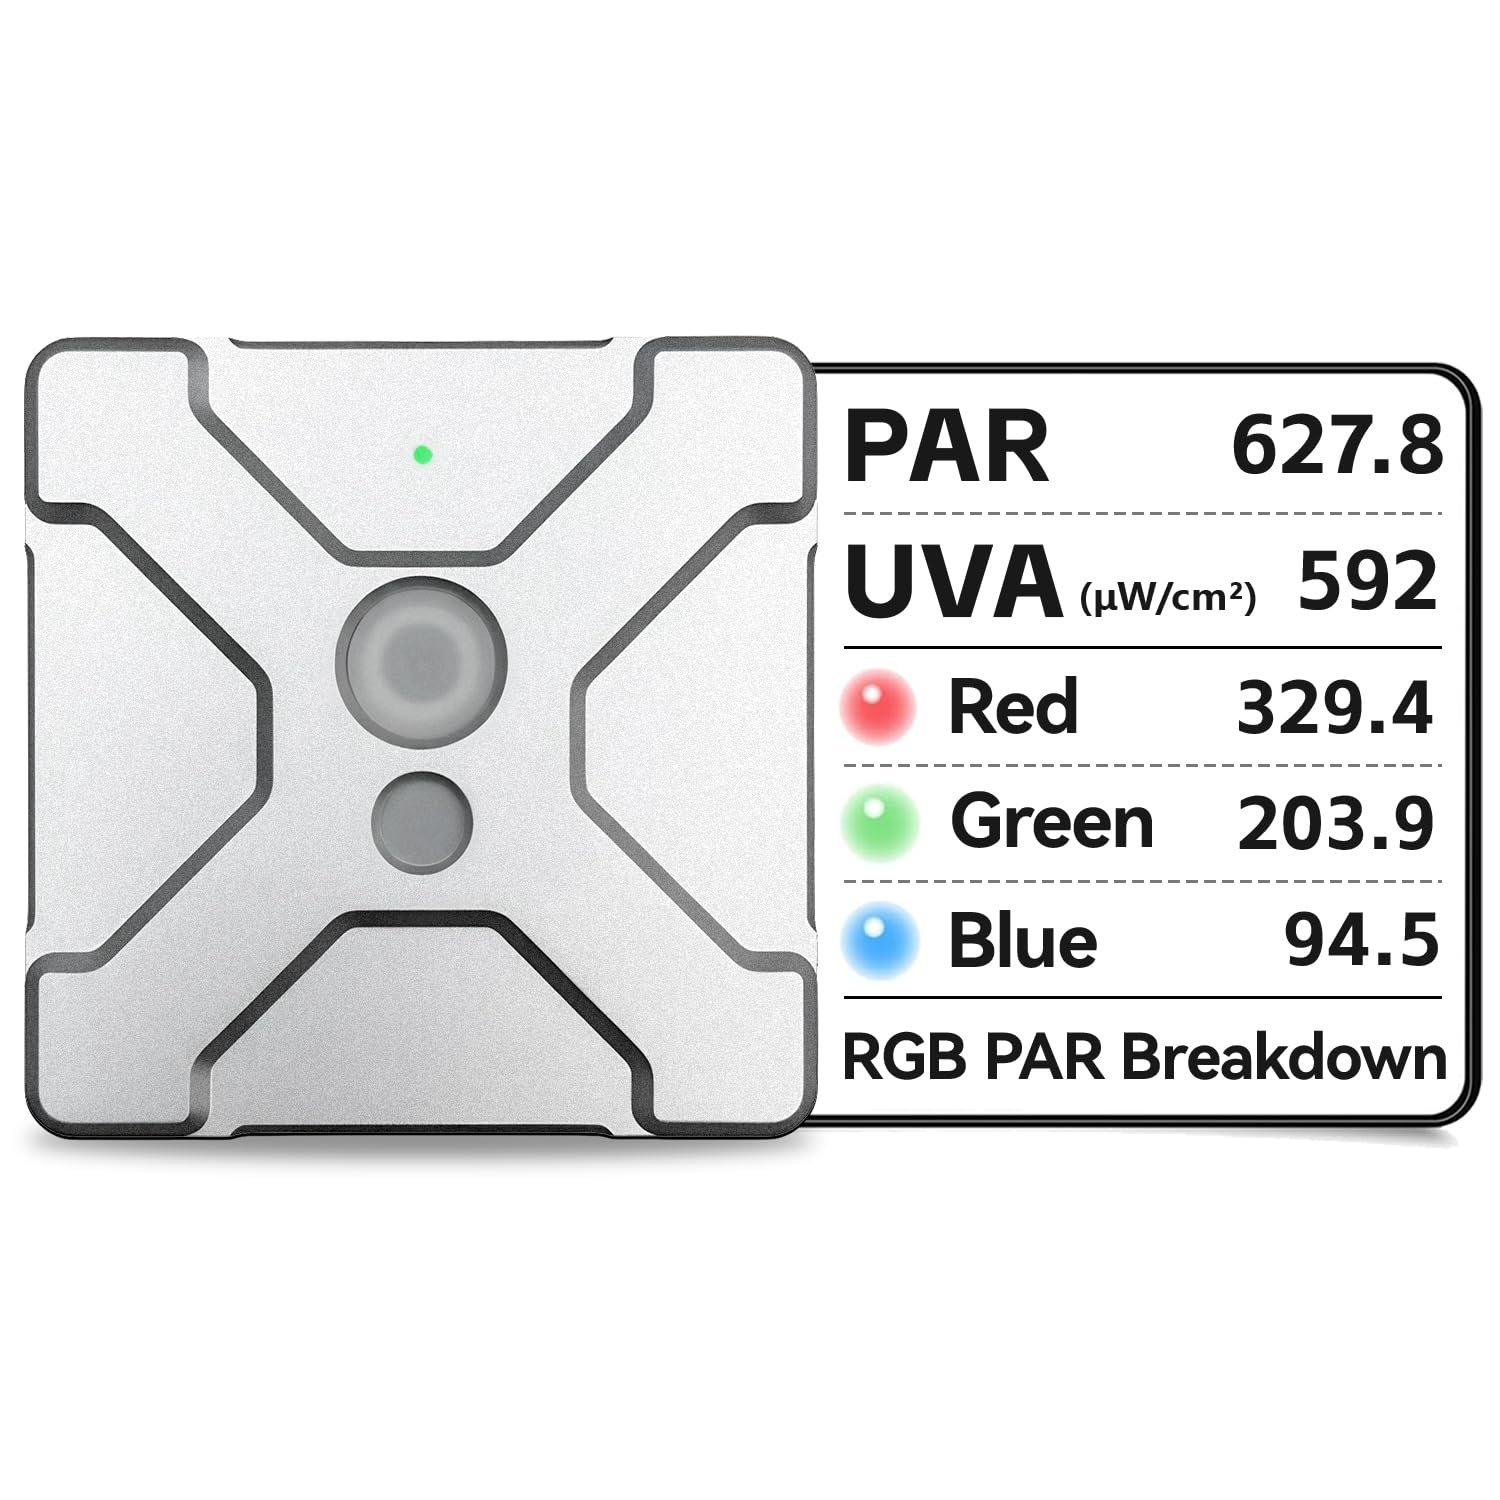
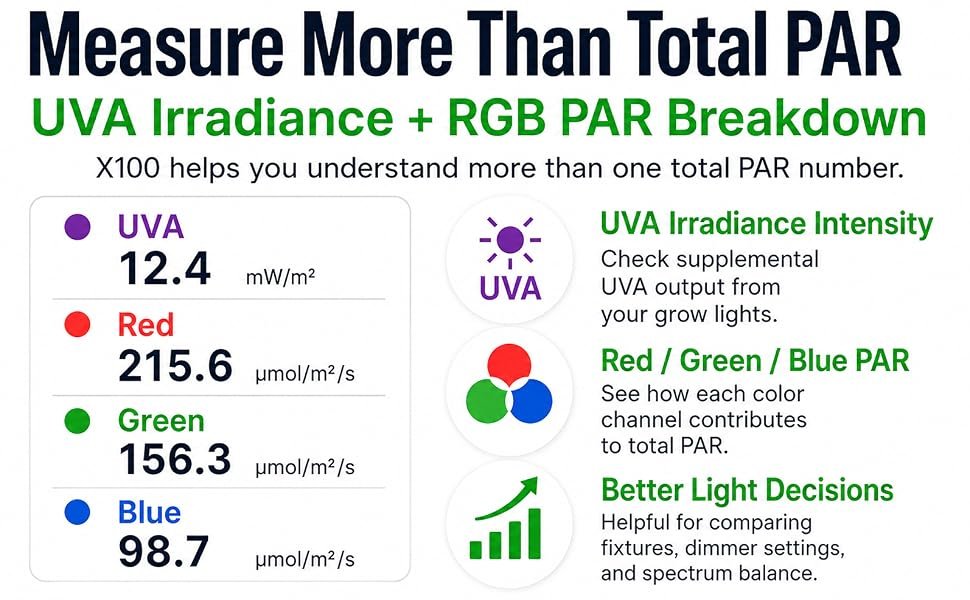
A single PAR value tells you total plant-light intensity at one point. X100 adds UVA and three broad visible PAR bands so you can compare how different grow lights deliver that total.
Measure the combined photosynthetic photon flux density at the measurement point.
Add a separate UVA reading when evaluating grow lights that include supplemental UVA output.
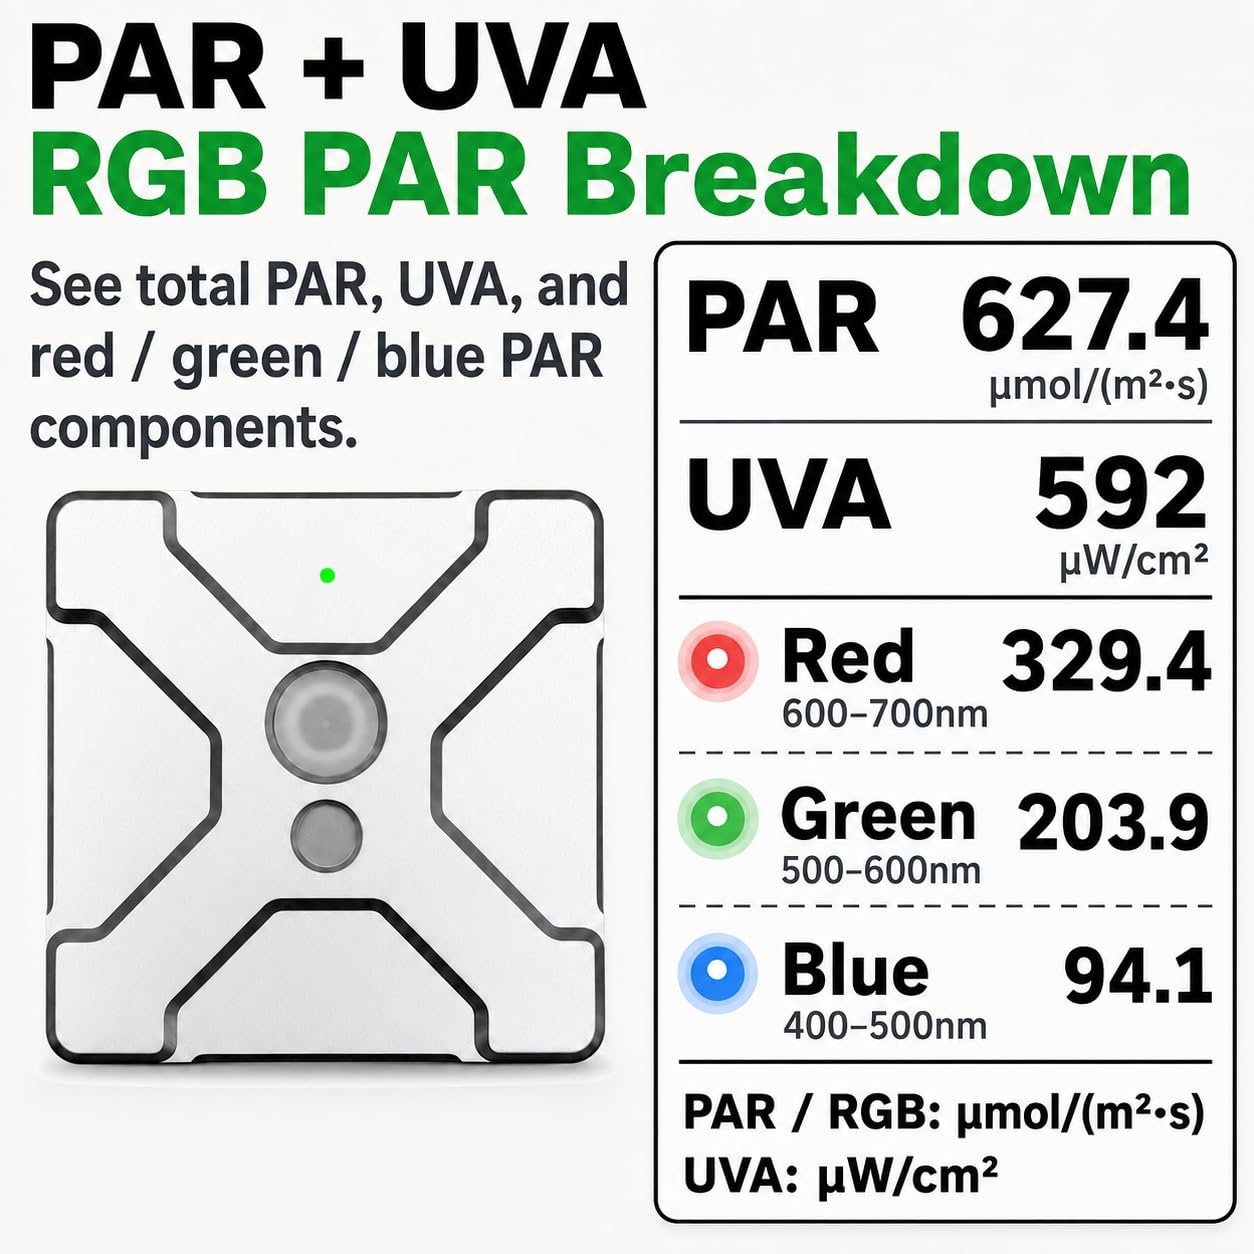
Review red, green and blue PAR contributions as measured photon-flux components, not just a color percentage.
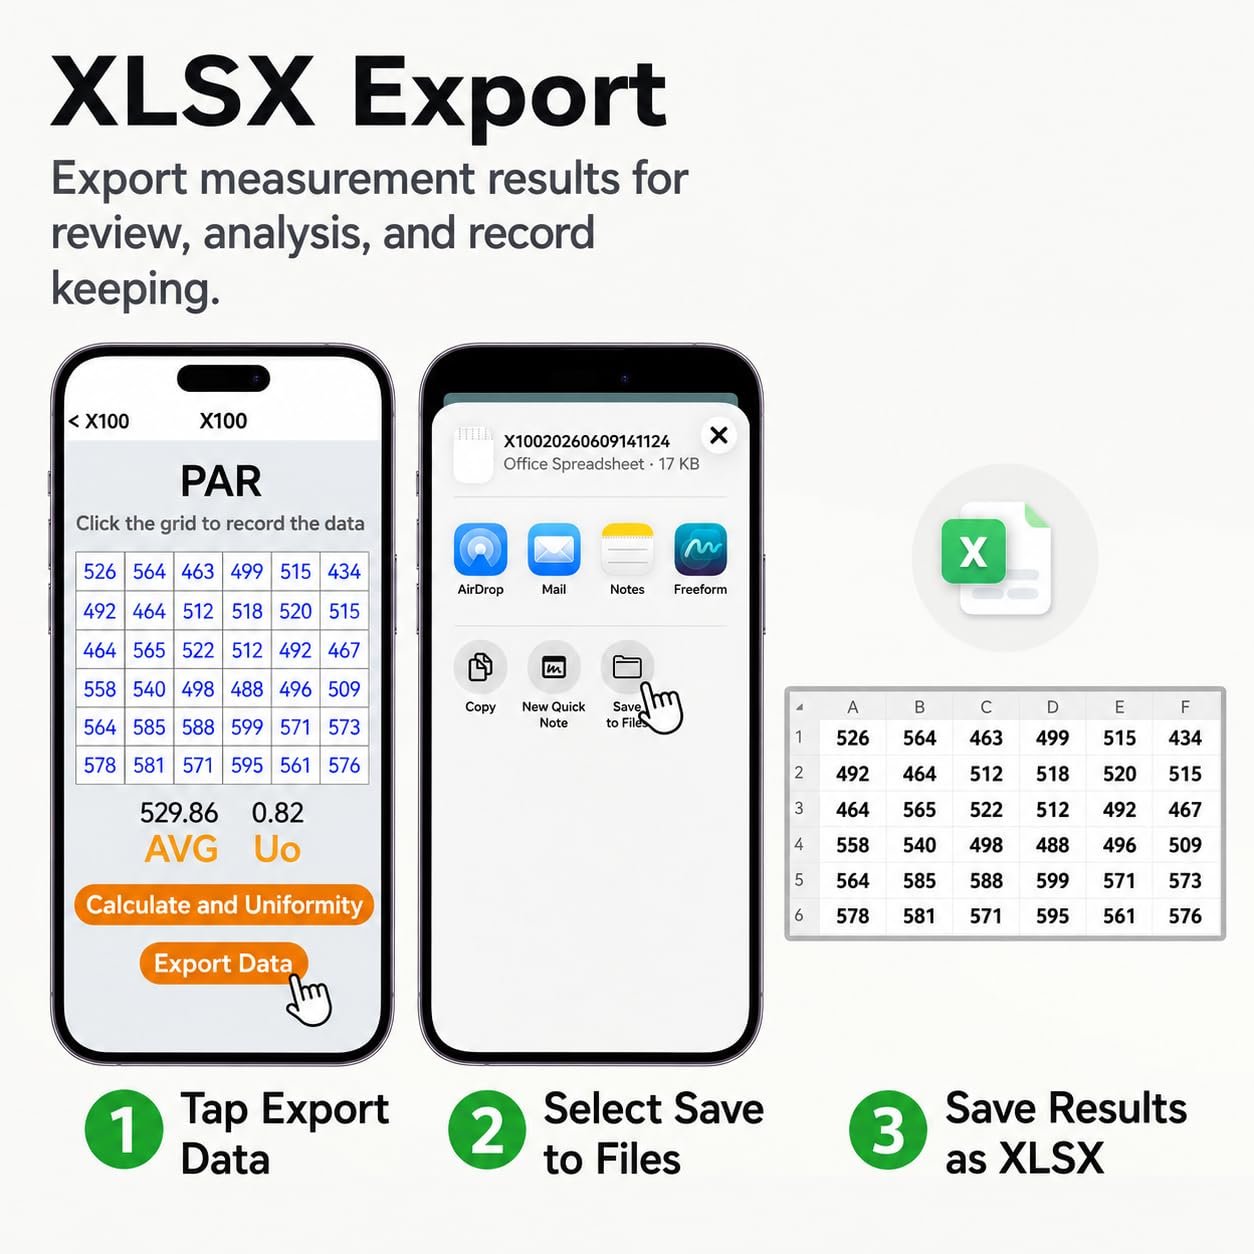
Save measurement grids as XLSX files for records, spreadsheets, analysis and later visualization.
X100 displays total PAR together with UVA and separate red, green and blue PAR components. This is useful when two fixtures produce similar total PPFD but use different spectral balances.
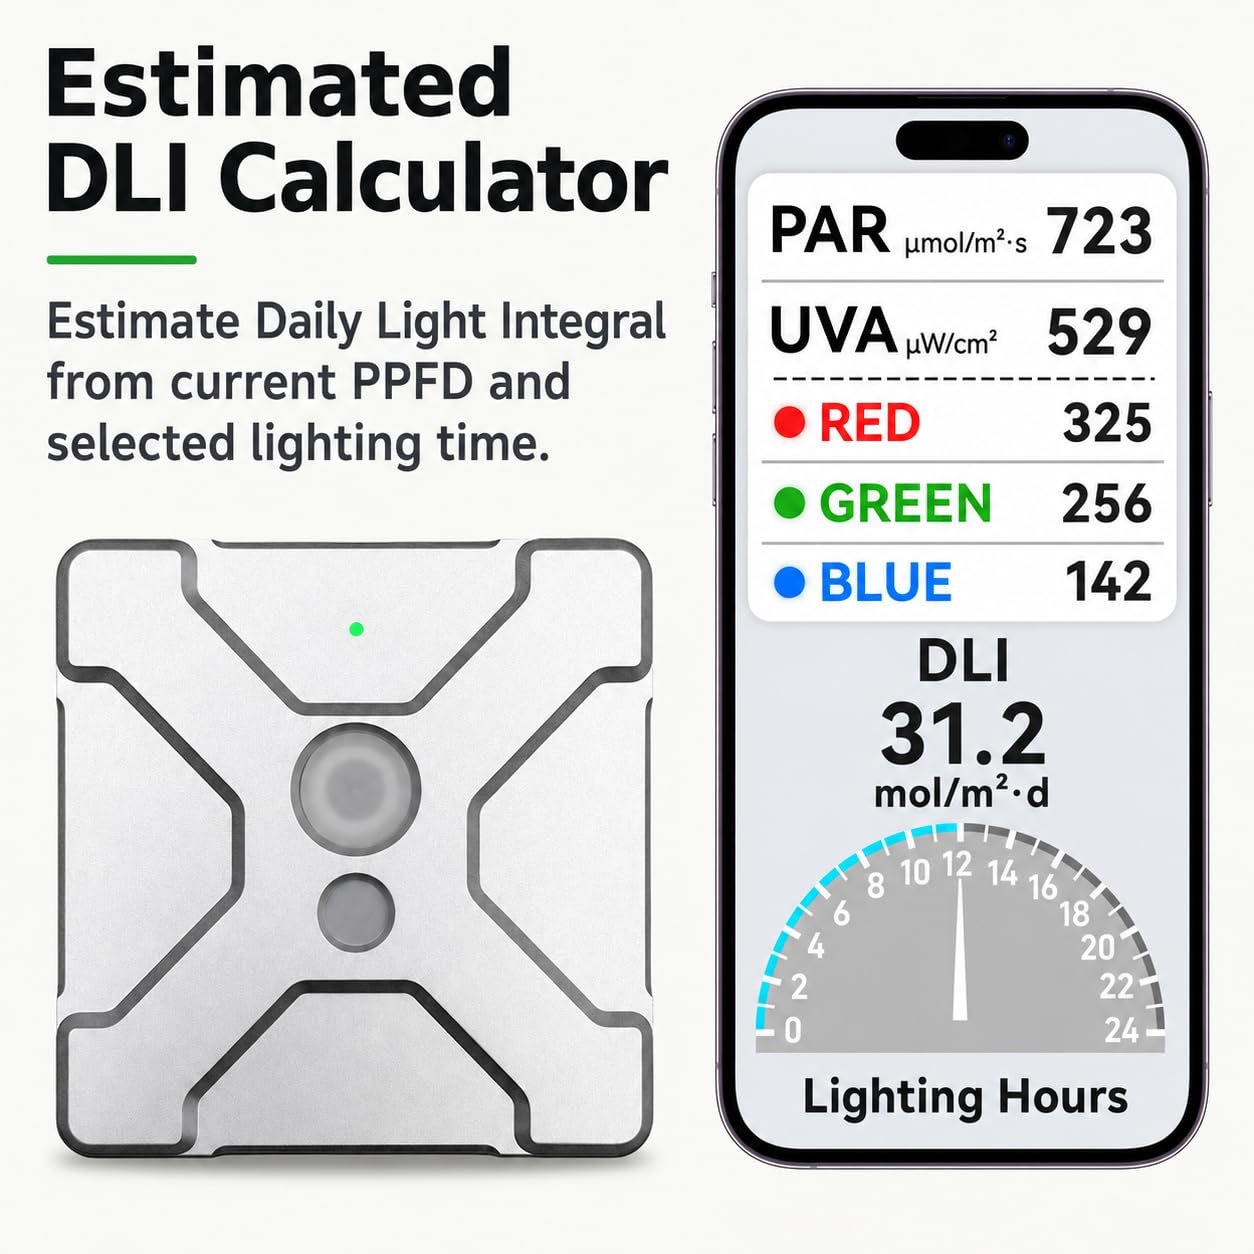
Select the lighting duration and use the current PPFD reading to estimate Daily Light Integral. This makes it easier to translate an instantaneous measurement into a daily-light planning number for controlled lighting schedules.
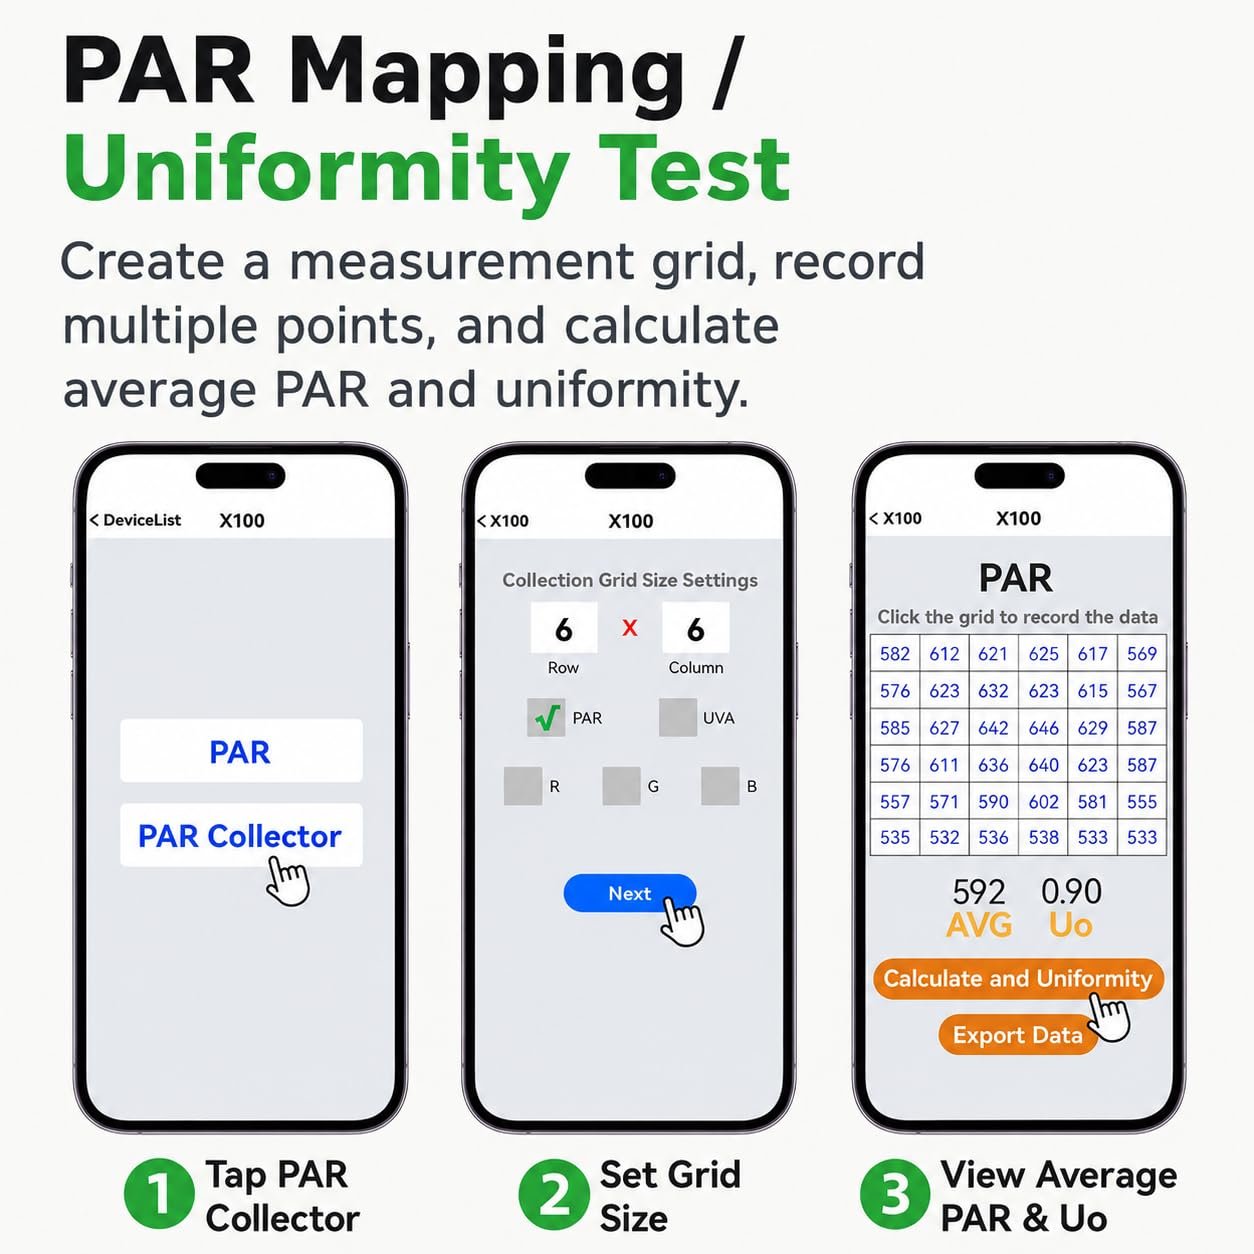
Create a measurement grid, record PAR at each point and let the app summarize the grid with average PAR and uniformity U0. This helps compare center-to-edge performance, fixture height, spacing and dimmer settings.
Export your recorded measurement grid to an XLSX file so the data can move beyond the phone into your own spreadsheet, report or analysis workflow.

X100 is designed for users who want more context around a grow light than one center PPFD reading. Total PAR shows intensity, UVA adds ultraviolet information, RGB PAR components show broad-band contribution, and grid testing shows how the fixture performs across space.
Use X100 when you want active spot measurements, RGB PAR breakdown, mapping and spreadsheet export. Use EVO-100 when the priority is fixed-position WiFi monitoring over time.
Best for moving through a grow area, comparing fixtures or settings, collecting grids and exporting measurement data.
Best for leaving the sensor at a fixed canopy location and reviewing how PPFD/PAR and UVA change through Day, Month and Year curves.
The table below stays within the functions and wavelength bands shown in the supplied X100 materials.
| Primary measurement | Total PAR / PPFD |
|---|---|
| Additional optical measurement | UVA irradiance |
| Blue PAR component | 400–500 nm |
| Green PAR component | 500–600 nm |
| Red PAR component | 600–700 nm |
| PAR / RGB PAR unit shown | µmol/(m²·s) |
| DLI function | Estimated DLI from current PPFD and selected lighting hours |
| Grid function | Configurable PAR measurement grid with average PAR and uniformity U0 |
| Data export | XLSX spreadsheet export |
| Visualization workflow | Exported XLSX data can be used in external spreadsheet or AI analysis tools for heatmaps and other visualizations |
X100 measures total PAR/PPFD, UVA irradiance and separate red, green and blue PAR components. It also supports estimated DLI, multi-point PAR grid measurement, uniformity review and XLSX export.
No. The supplied X100 materials present the RGB values as PAR components in µmol/(m²·s): blue 400–500 nm, green 500–600 nm and red 600–700 nm.
No. X100 provides three broad RGB PAR bands rather than a full wavelength-by-wavelength spectral graph. This makes it useful for broad spectral-balance comparison without describing it as a full spectrometer.
X100 provides an estimated DLI calculator based on the current PPFD reading and the lighting duration you select. The estimate is most representative when PPFD remains relatively stable during that period.
Yes. The PAR Collector workflow lets you set a grid, record multiple measurement points and review average PAR together with uniformity U0.
Yes. X100 can export measurement results as an XLSX spreadsheet file for record keeping, comparison and further analysis.
X100 exports the measured grid data. You can then use the XLSX file with the spreadsheet or AI analysis tool of your choice to create a heatmap or other visualization.
Choose X100 for active spot measurement, RGB PAR breakdown, grid mapping and XLSX export. Choose EVO-100 for fixed-position WiFi monitoring of PPFD/PAR and UVA over longer time periods.
Use X100 to compare total PAR, UVA, RGB PAR components and fixture uniformity — then export the results for your own records and analysis.